class: center, middle, inverse, title-slide # Module 1: Hospital Pricing and Selection on Observables ## Part 1: HCRIS Data ### Ian McCarthy | Emory University ### Econ 470 & HLTH 470 --- <!-- Adjust some CSS code for font size and maintain R code font size --> <style type="text/css"> .remark-slide-content { font-size: 30px; padding: 1em 2em 1em 2em; } .remark-code { font-size: 15px; } .remark-inline-code { font-size: 20px; } </style> <!-- Set R options for how code chunks are displayed and load packages --> # What is a hospital price? Defining characteristic of hospital services: *it's complicated!* -- .center[ 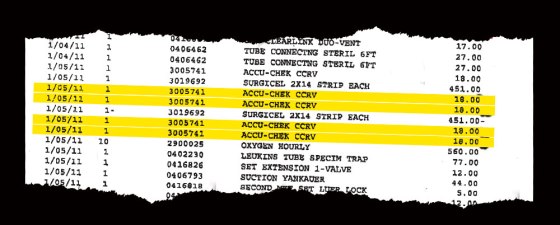 ] <div class="smalltext">Brill, Steven. 2013. "Bitter Pill: Why Medical Bills are Killing Us." *Time Magazine*.</div> --- # What is a hospital price? Lots of different payers paying lots of different prices: - [Medicare fee-for-service prices](https://www.cms.gov/Outreach-and-Education/Medicare-Learning-Network-MLN/MLNProducts/Downloads/AcutePaymtSysfctsht.pdf) - [Medicaid payments](https://www.kff.org/report-section/understanding-medicaid-hospital-payments-and-the-impact-of-recent-policy-changes-issue-brief/) - Private insurance negotiations (including Medicare Advantage) - But what about the price to patients? -- .center[ Price `\(\neq\)` charge `\(\neq\)` cost `\(\neq\)` patient out-of-pocket spending ] --- # What is a hospital price? .center[  ] <div class="smalltext">Source: <a href="https://healthcarepricingproject.org/">Health Care Pricing Project</a></div> --- # What is a hospital price? Not clear what exactly is negotiated... -- .pull-left[ ### Fee-for-service - price per procedure - percentage of charges - markup over Medicare rates ] -- .pull-right[ ### Capitation - payment per patient - pay-for-performance - shared savings ] --- # Hospital prices in real life A few empirical facts: 1. Hospital services are expensive 2. Prices vary dramatically across different areas 3. Lack of competition is a major reason for high prices --- # Hospital prices in real life .pull-left[  ] .pull-right[  ] <div class="smalltext">Source: <a href="https://healthcarepricingproject.org/">Health Care Pricing Project</a></div> <!-- New Section --> --- class: inverse, center, middle name: hcris # Understanding HCRIS Data <html><div style='float:left'></div><hr color='#EB811B' size=1px width=1055px></html> --- # What is HCRIS? Healthcare Cost Report Information System ('cost reports') - Nursing Homes (SNFs) - Hospice - Home Health Agencies - Hospitals --- # Hospital Cost Reports .center[ 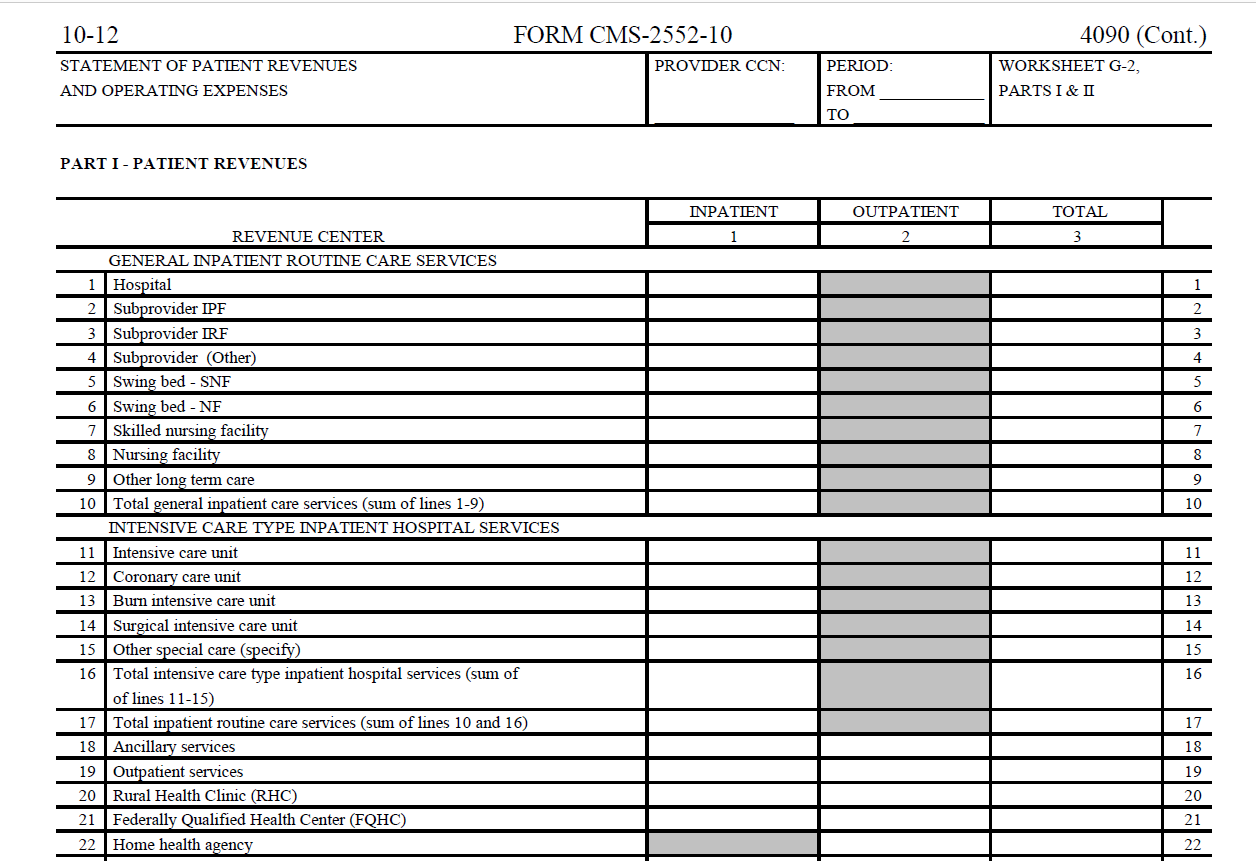 ] --- # The Data Let's work with the [HCRIS GitHub repository](https://github.com/imccart/HCRIS). But forming the dataset is up to you this time. -- .center[  ] --- # The Data ```r hcris.data %>% ggplot(aes(x=as.factor(year))) + geom_bar() + labs( x="Year", y="Number of Hospitals", title="Number of Hospitals per Year" ) + theme_bw() + theme(axis.text.x = element_text(angle = 90, hjust=1)) ``` .plot-callout[ <img src="01-hospital-pricing1_files/figure-html/hospital-count-callout-1.png" style="display: block; margin: auto;" /> ] --- # Number of hospitals <img src="01-hospital-pricing1_files/figure-html/hospital-count-output-1.png" style="display: block; margin: auto;" /> --- # Estimating hospital prices ```r hcris.data <- hcris.data %>% mutate( discount_factor = 1-tot_discounts/tot_charges, price_num = (ip_charges + icu_charges + ancillary_charges)*discount_factor - tot_mcare_payment, price_denom = tot_discharges - mcare_discharges, price = price_num/price_denom) ``` --- # Estimating hospital prices .left-code[ ```r hcris.data %>% group_by(year) %>% filter(price_denom>10, !is.na(price_denom), price_num>0, !is.na(price_num)) %>% select(price, year) %>% summarize(mean_price=mean(price, na.rm=TRUE)) %>% ggplot(aes(x=as.factor(year), y=mean_price)) + geom_line(aes(group=1)) + labs( x="Year", y="Average Hospital Price", title="Hospital Prices per Year" ) + scale_y_continuous(labels=comma) + theme_bw() + theme(axis.text.x = element_text(angle = 90, hjust=1)) ``` ] .right-plot[ 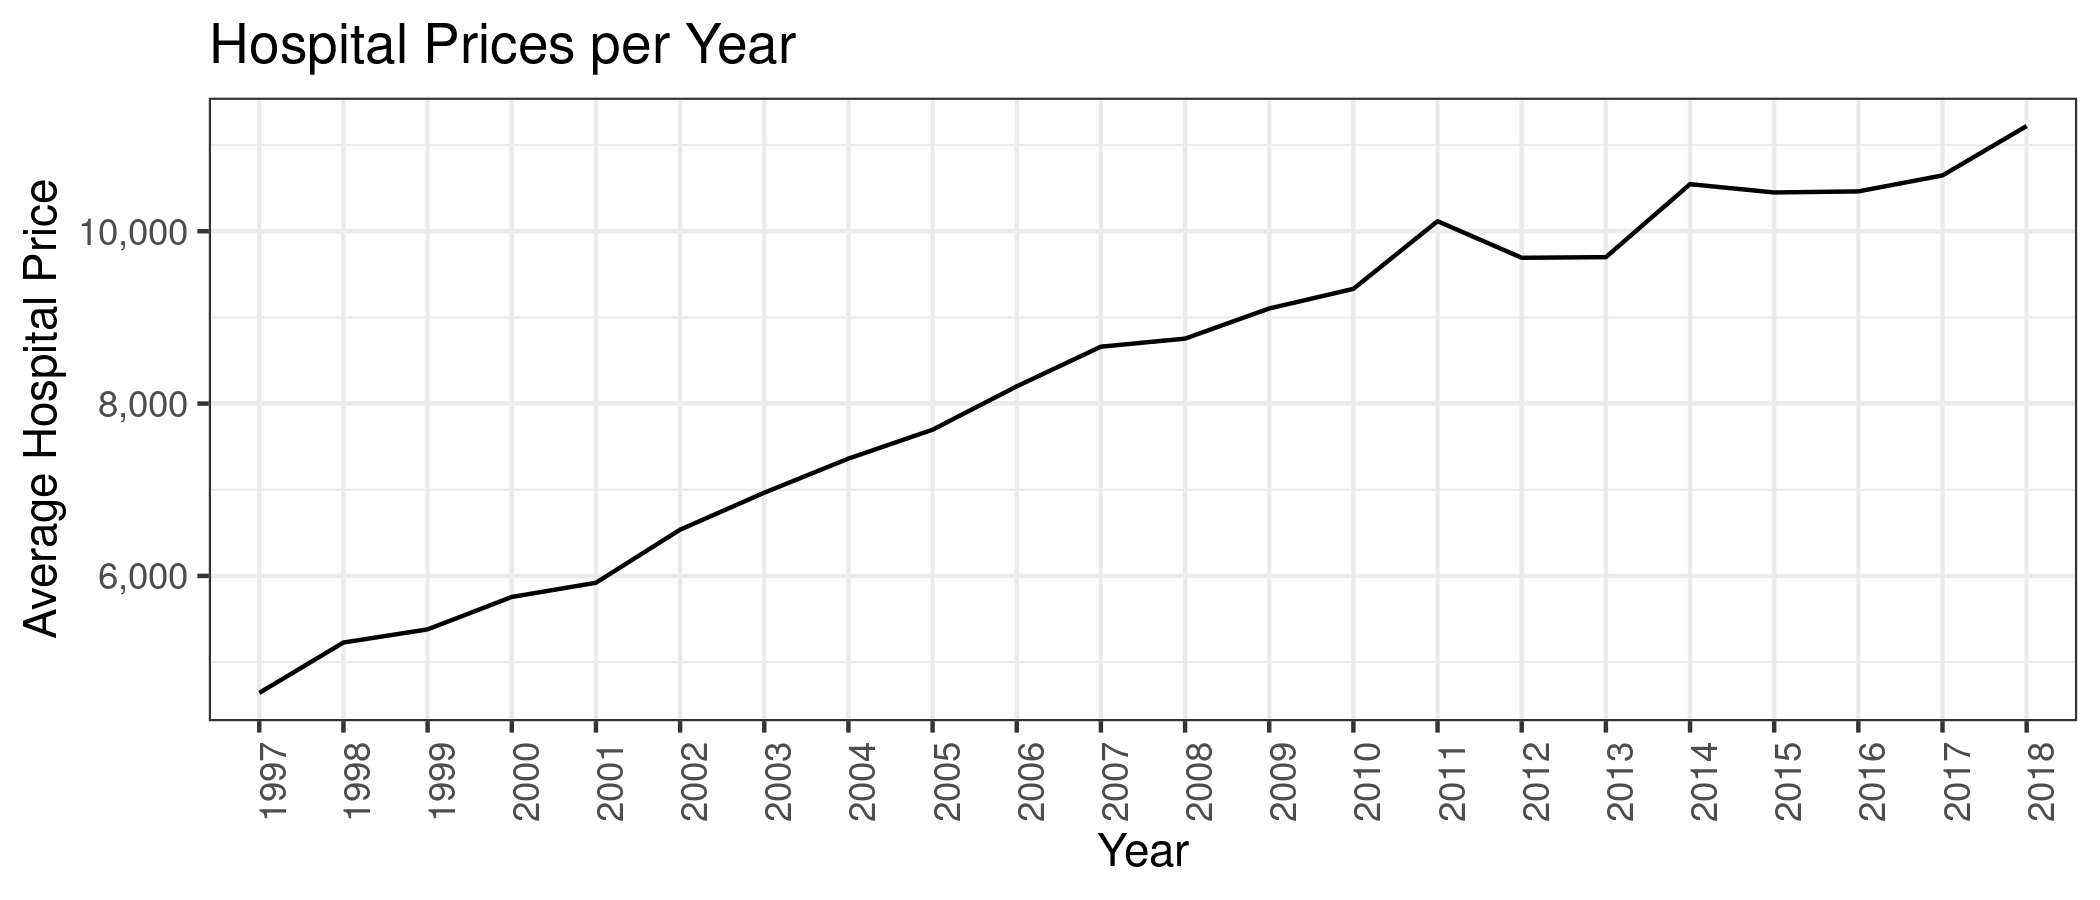 ] --- # Estimating hospital prices .left-code[ ```r hcris.data %>% group_by(year) %>% filter(price_denom>100, !is.na(price_denom), price_num>0, !is.na(price_num), * price<100000) %>% select(price, year) %>% summarize(mean_price=mean(price, na.rm=TRUE)) %>% ggplot(aes(x=as.factor(year), y=mean_price)) + geom_line(aes(group=1)) + labs( x="Year", y="Average Hospital Price", title="Hospital Prices per Year" ) + scale_y_continuous(labels=comma) + theme_bw() + theme(axis.text.x = element_text(angle = 90, hjust=1)) ``` ] .right-plot[ 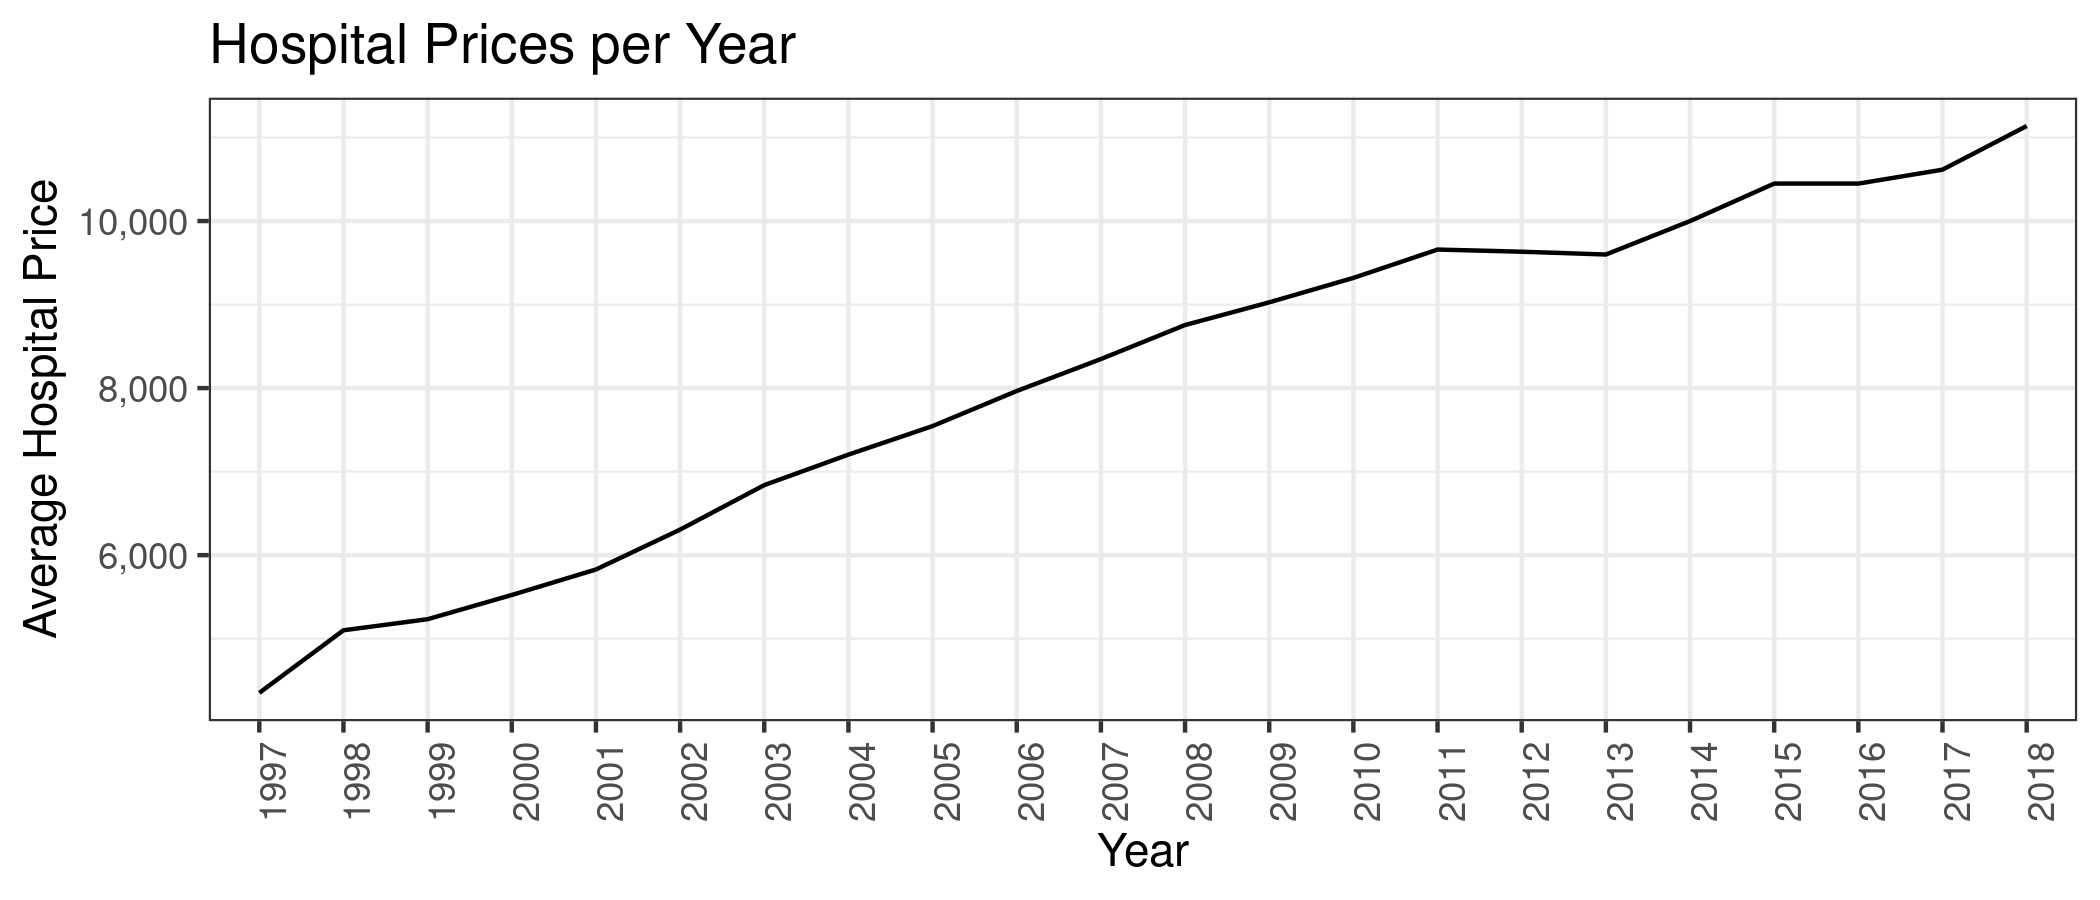 ]