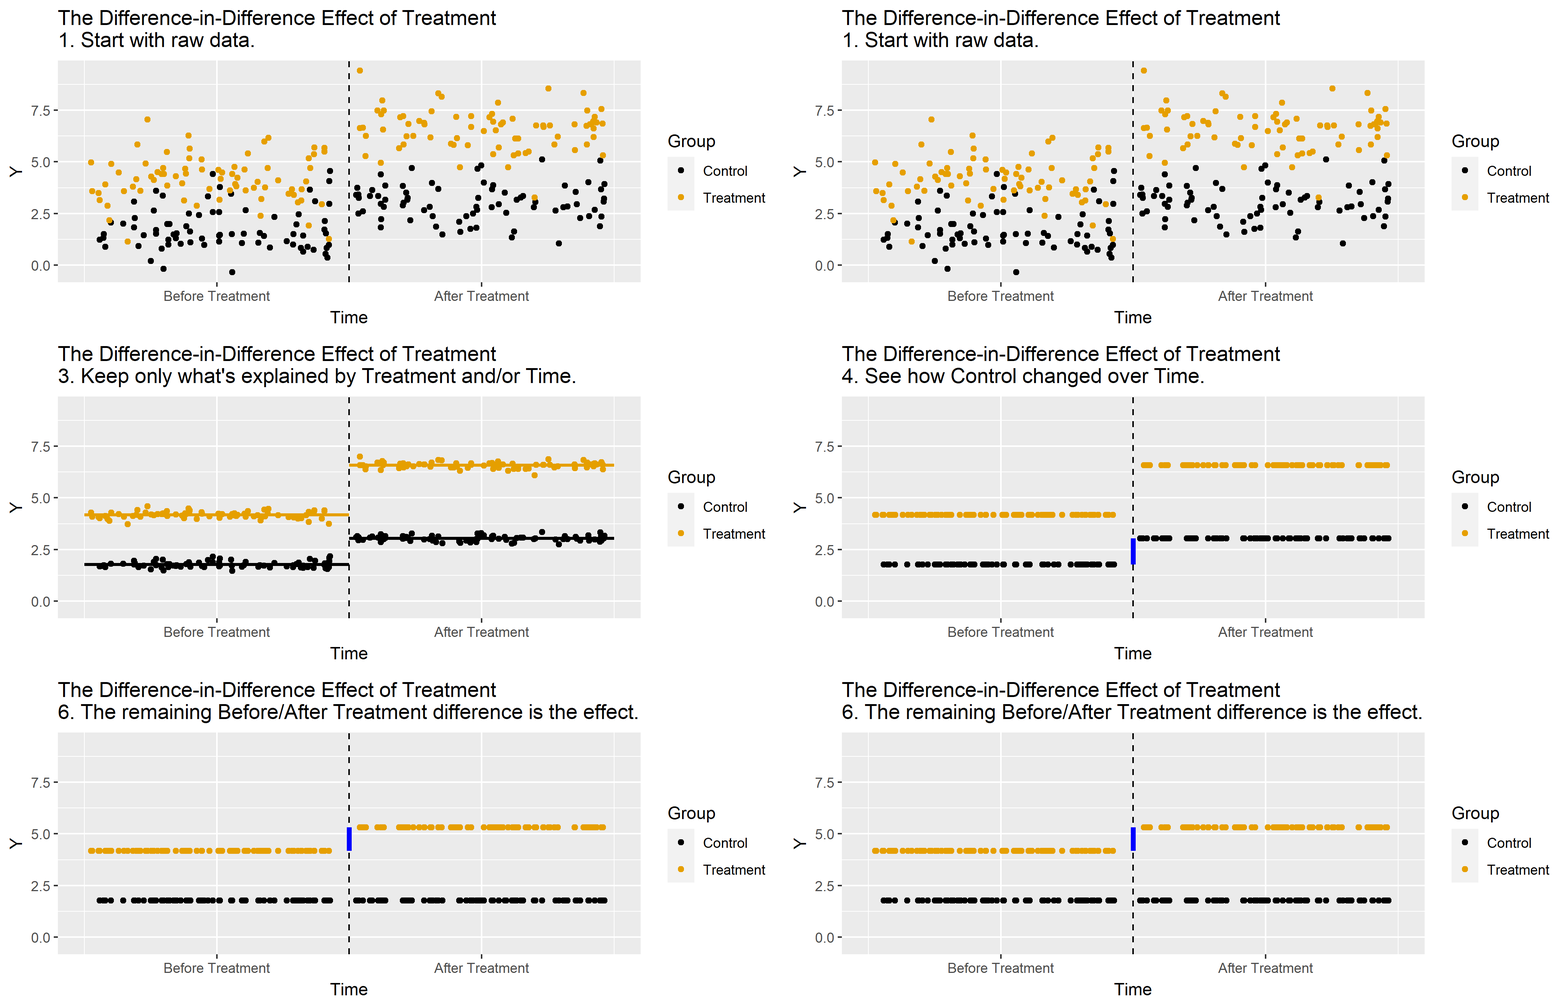
class: center, middle, inverse, title-slide # Module 4: Difference-in-Differences and Effects of Medicaid Expansion ## Part 2: Understanding Difference-in-Differences ### Ian McCarthy | Emory University ### Econ 470 & HLTH 470 --- <!-- Adjust some CSS code for font size and maintain R code font size --> <style type="text/css"> .remark-slide-content { font-size: 30px; padding: 1em 2em 1em 2em; } .remark-code { font-size: 15px; } .remark-inline-code { font-size: 20px; } </style> <!-- Set R options for how code chunks are displayed and load packages --> # Setup - Denote by `\(Y_{1}(t)\)` the (potential) outcome at time `\(t\)` with treatment - Denote by `\(Y_{0}(t)\)` the (potential) outcome at time `\(t\)` without treatment - Consider `\(t=0\)` as the pre-period, `\(t=1\)` as the post-period - Four potential outcomes: `\(Y_{1}(0)\)`, `\(Y_{1}(1)\)`, `\(Y_{0}(0)\)`, and `\(Y_{0}(1)\)`. --- # Setup Want to estimate `\(ATT=E[Y_{1}(1)- Y_{0}(1) | D=1]\)` ![:col_header , Post-period, Pre-period] ![:col_row Treated, `\(E(Y_{1}(1)|D=1)\)`, `\(E(Y_{0}(0)|D=1)\)`] ![:col_row Control, `\(E(Y_{0}(1)|D=0)\)`, `\(E(Y_{0}(0)|D=0)\)`] <br> Problem: We don't see `\(E[Y_{0}(1)|D=1]\)` --- # Setup Want to estimate `\(ATT=E[Y_{1}(1)- Y_{0}(1) | D=1]\)` ![:col_header , Post-period, Pre-period] ![:col_row Treated, `\(E(Y_{1}(1)|D=1)\)`, `\(E(Y_{0}(0)|D=1)\)`] ![:col_row Control, `\(E(Y_{0}(1)|D=0)\)`, `\(E(Y_{0}(0)|D=0)\)`] <br> Strategy 1: Estimate `\(E[Y_{0}(1)|D=1]\)` using `\(E[Y_{0}(0)|D=1]\)` (before treatment outcome used to estimate post-treatment) --- # Setup Want to estimate `\(ATT=E[Y_{1}(1)- Y_{0}(1) | D=1]\)` ![:col_header , Post-period, Pre-period] ![:col_row Treated, `\(E(Y_{1}(1)|D=1)\)`, `\(E(Y_{0}(0)|D=1)\)`] ![:col_row Control, `\(E(Y_{0}(1)|D=0)\)`, `\(E(Y_{0}(0)|D=0)\)`] <br> Strategy 2: Estimate `\(E[Y_{0}(1)|D=1]\)` using `\(E[Y_{0}(1)|D=0]\)` (control group used to predict outcome for treatment) --- # Setup Want to estimate `\(ATT=E[Y_{1}(1)- Y_{0}(1) | D=1]\)` ![:col_header , Post-period, Pre-period] ![:col_row Treated, `\(E(Y_{1}(1)|D=1)\)`, `\(E(Y_{0}(0)|D=1)\)`] ![:col_row Control, `\(E(Y_{0}(1)|D=0)\)`, `\(E(Y_{0}(0)|D=0)\)`] <br> Strategy 3: DD estimate... <br> Estimate `\(E[Y_{1}(1)|D=1] - E[Y_{0}(1)|D=1]\)` using `\(E[Y_{0}(1)|D=0] - E[Y_{0}(0)|D=0]\)` (pre-post difference in control group used to predict difference for treatment group) --- # Animations! .center[  ] --- # Estimation Key identifying assumption is that of *parallel trends* -- <br> <br> `$$E[Y_{0}(1) - Y_{0}(0)|D=1] = E[Y_{0}(1) - Y_{0}(0)|D=0]$$` --- # Estimation Sample means:<br> `$$\begin{align} E[Y_{1}(1) - Y_{0}(1)|D=1] &=& \left( E[Y(1)|D=1] - E[Y(1)|D=0] \right) \\ & & - \left( E[Y(0)|D=1] - E[Y(0)|D=0]\right) \end{align}$$` --- # Estimation Regression:<br> `\(Y_{i} = \alpha + \beta D_{i} + \lambda 1(Post) + \delta D_{i} \times 1(Post) + \varepsilon\)` <br> ![:col_header , After, Before, After - Before] ![:col_row Treated, `\(\alpha + \beta + \lambda + \delta\)`, `\(\alpha + \beta\)`, `\(\lambda + \delta\)`] ![:col_row Control, `\(\alpha + \lambda\)`, `\(\alpha\)`, `\(\lambda\)`] ![:col_row Treated - Control, `\(\beta + \delta\)`, `\(\beta\)`, `\(\delta\)`] --- # Simulated data ```r N <- 5000 dd.dat <- tibble( d = (runif(N, 0, 1)>0.5), time_pre = "pre", time_post = "post" ) dd.dat <- pivot_longer(dd.dat, c("time_pre","time_post"), values_to="time") %>% select(d, time) %>% mutate(t=(time=="post"), y.out=1.5+3*d + 1.5*t + 6*d*t + rnorm(N*2,0,1)) ``` --- # Mean differences ```r dd.means <- dd.dat %>% group_by(d, t) %>% summarize(mean_y = mean(y.out)) knitr::kable(dd.means, col.names=c("Treated","Post","Mean"), format="html") ``` <table> <thead> <tr> <th style="text-align:left;"> Treated </th> <th style="text-align:left;"> Post </th> <th style="text-align:right;"> Mean </th> </tr> </thead> <tbody> <tr> <td style="text-align:left;"> FALSE </td> <td style="text-align:left;"> FALSE </td> <td style="text-align:right;"> 1.522635 </td> </tr> <tr> <td style="text-align:left;"> FALSE </td> <td style="text-align:left;"> TRUE </td> <td style="text-align:right;"> 3.002374 </td> </tr> <tr> <td style="text-align:left;"> TRUE </td> <td style="text-align:left;"> FALSE </td> <td style="text-align:right;"> 4.515027 </td> </tr> <tr> <td style="text-align:left;"> TRUE </td> <td style="text-align:left;"> TRUE </td> <td style="text-align:right;"> 12.004623 </td> </tr> </tbody> </table> --- # Mean differences In this example: - `\(E[Y(1)|D=1] - E[Y(1)|=0]\)` is 9.0022495 - `\(E[Y(0)|D=1] - E[Y(0)|D=0]\)` is 2.9923925 <br> <br> So the ATT is 6.0098571 --- # Regression estimator ```r dd.est <- lm(y.out ~ d + t + d*t, data=dd.dat) summary(dd.est) ``` ``` ## ## Call: ## lm(formula = y.out ~ d + t + d * t, data = dd.dat) ## ## Residuals: ## Min 1Q Median 3Q Max ## -4.0038 -0.6674 0.0047 0.6609 3.6135 ## ## Coefficients: ## Estimate Std. Error t value Pr(>|t|) ## (Intercept) 1.52263 0.01970 77.28 <2e-16 *** ## dTRUE 2.99239 0.02795 107.07 <2e-16 *** ## tTRUE 1.47974 0.02786 53.10 <2e-16 *** ## dTRUE:tTRUE 6.00986 0.03953 152.05 <2e-16 *** ## --- ## Signif. codes: 0 '***' 0.001 '**' 0.01 '*' 0.05 '.' 0.1 ' ' 1 ## ## Residual standard error: 0.9881 on 9996 degrees of freedom ## Multiple R-squared: 0.9433, Adjusted R-squared: 0.9433 ## F-statistic: 5.543e+04 on 3 and 9996 DF, p-value: < 2.2e-16 ```