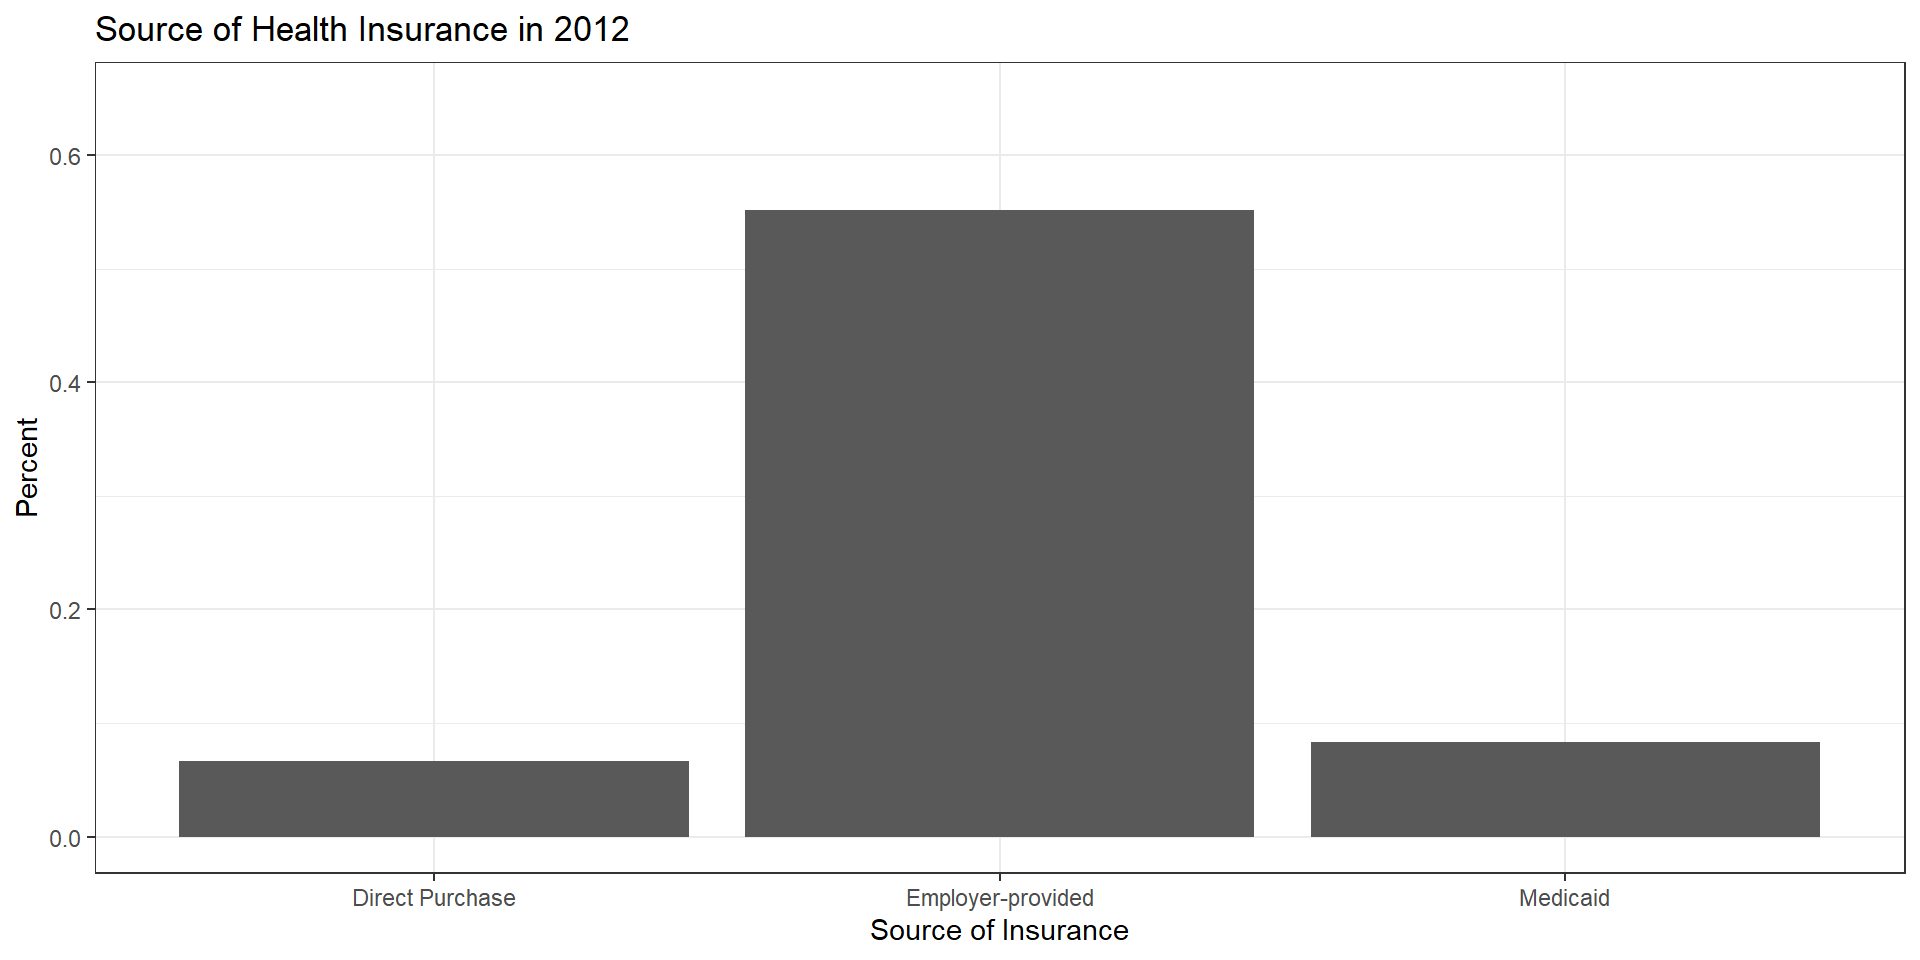
ins.dat %>%filter(year==2012) %>%pivot_longer(c("perc_employer","perc_direct","perc_medicaid")) %>%select(State, name, value) %>%group_by(name) %>%summarize(mean=mean(value)) %>%ggplot(aes(x=name, y=mean)) +geom_col() +ylim(0,0.65) +labs(x="Source of Insurance",y="Percent",title="Source of Health Insurance in 2012" ) +theme_bw() +scale_x_discrete(labels=c('perc_direct'='Direct Purchase','perc_employer'='Employer-provided','perc_medicaid'='Medicaid'))
Employer provided insurance
The U.S. still relies heavily on private insurance provided by employers.
Any thoughts on why?
Employer provided insurance
Stabalization act of 1942 (wages frozen but not benefits)
Tax exclusion for insurance expenditures (1954)
How did the ACA change things?
Create health insurance exchanges
Individual mandate (since set to $0)
Premium and cost-sharing subsidies (some unpaid by Trump administration)
Insurance subsidies (removed before intended)
Decision assistance
Minimum benefits and community ratings
Stay on parent’s plan to 26
How did the ACA change things?
Medicaid Expansion
Originally tied to federal funding
Made voluntary by supreme court ruling
Higher initial federal match rate, decreasing over time
Pay-for-performance measures
Hospital value-based purchasing
Hospital readmission reduction
Medicare Advantage quality improvement program
Bundled payments and ACOs (related)
Change in Insurance Type over Time
R Code
## Count of plans by type (across years)mean.dat <- ins.dat %>%pivot_longer(c("perc_employer","perc_direct","perc_medicaid", "perc_medicare")) %>%select(State, name, value, year) %>%group_by(name, year) %>%summarize(mean=mean(value)) %>%ungroup()mean.dat <- mean.dat %>%mutate(name =as.factor(name)) %>%mutate(name =fct_recode(name,"Direct Purchase"="perc_direct","Employer-provided"="perc_employer","Medicaid"="perc_medicaid","Medicare"="perc_medicare"))plot_ly(mean.dat,y=~name, x=~mean, frame=~as.factor(year), type='bar',width=800,height=400) %>%animation_slider(currentvalue =list(prefix ="Year ", font =list(color="blue")) ) %>%layout(xaxis =list(title ="Fraction of Population"), yaxis =list(title =""))
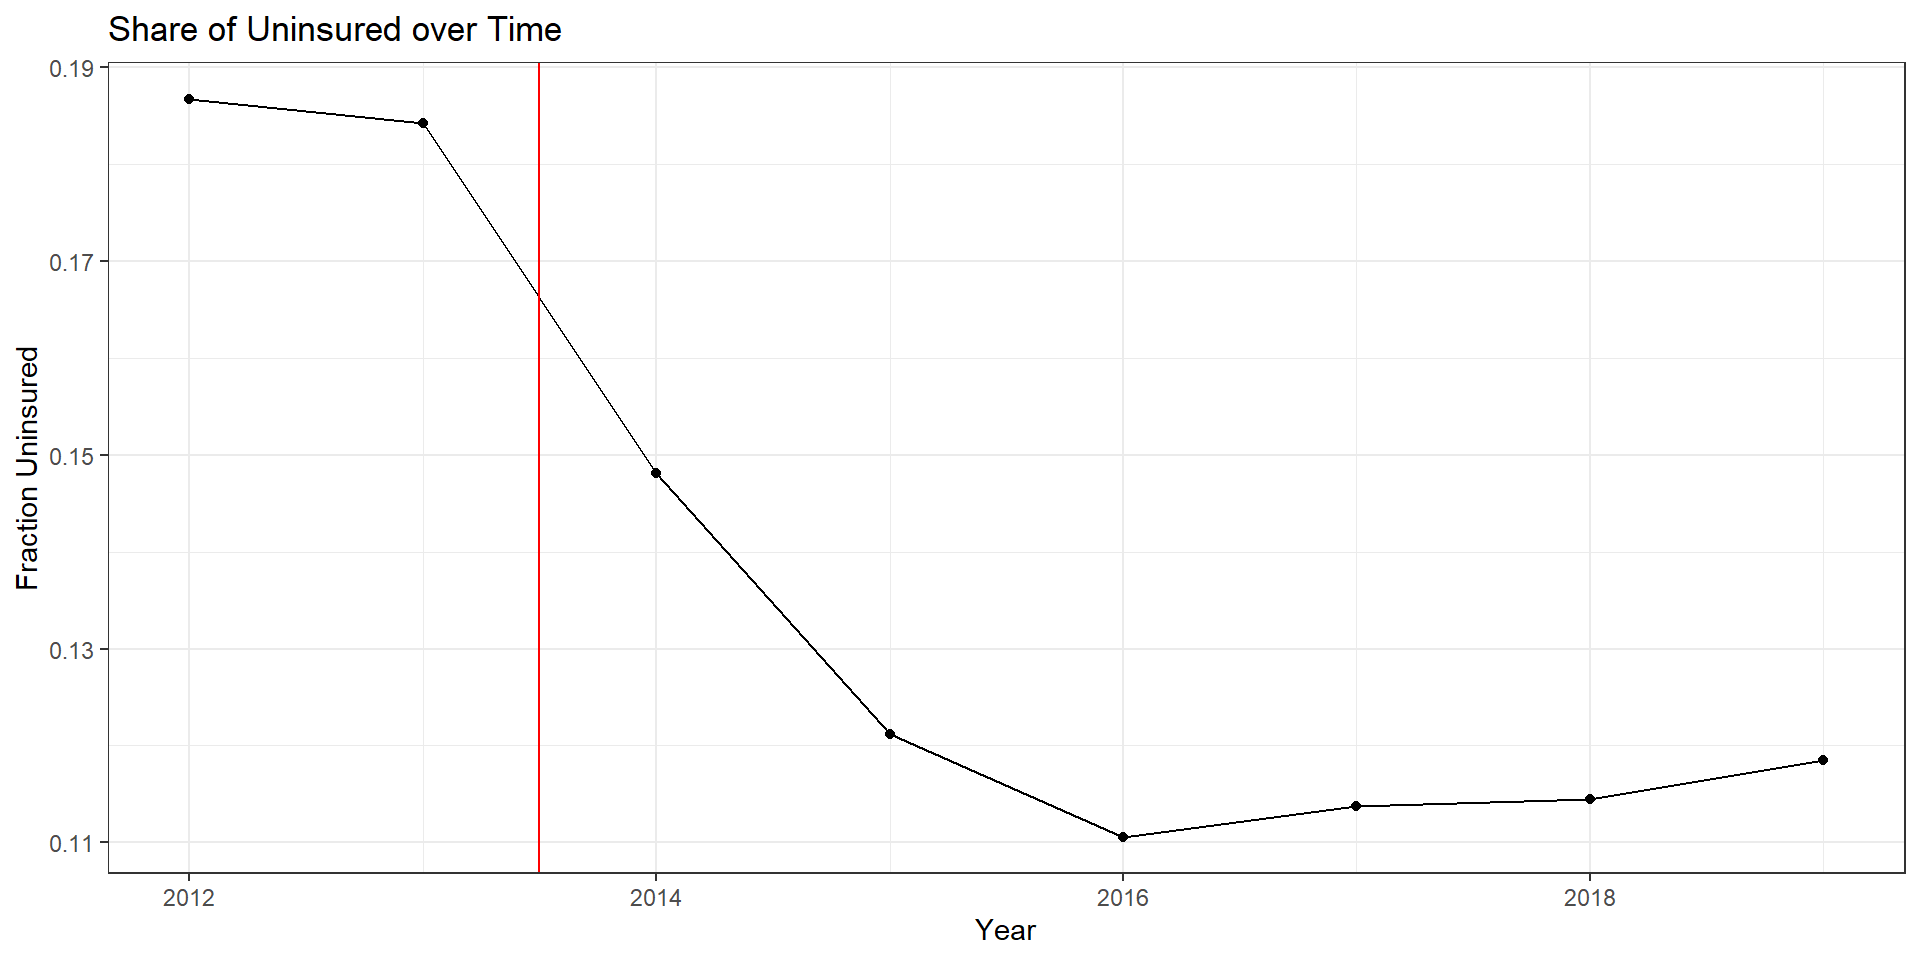
Uninsurance over time
R Code
ins.dat %>%group_by(year) %>%summarize(mean=mean(perc_unins)) %>%ggplot(aes(x=year,y=mean)) +geom_line() +geom_point() +theme_bw() +labs(x="Year",y="Fraction Uninsured",title="Share of Uninsured over Time" ) +geom_vline(xintercept=2013.5, color="red")
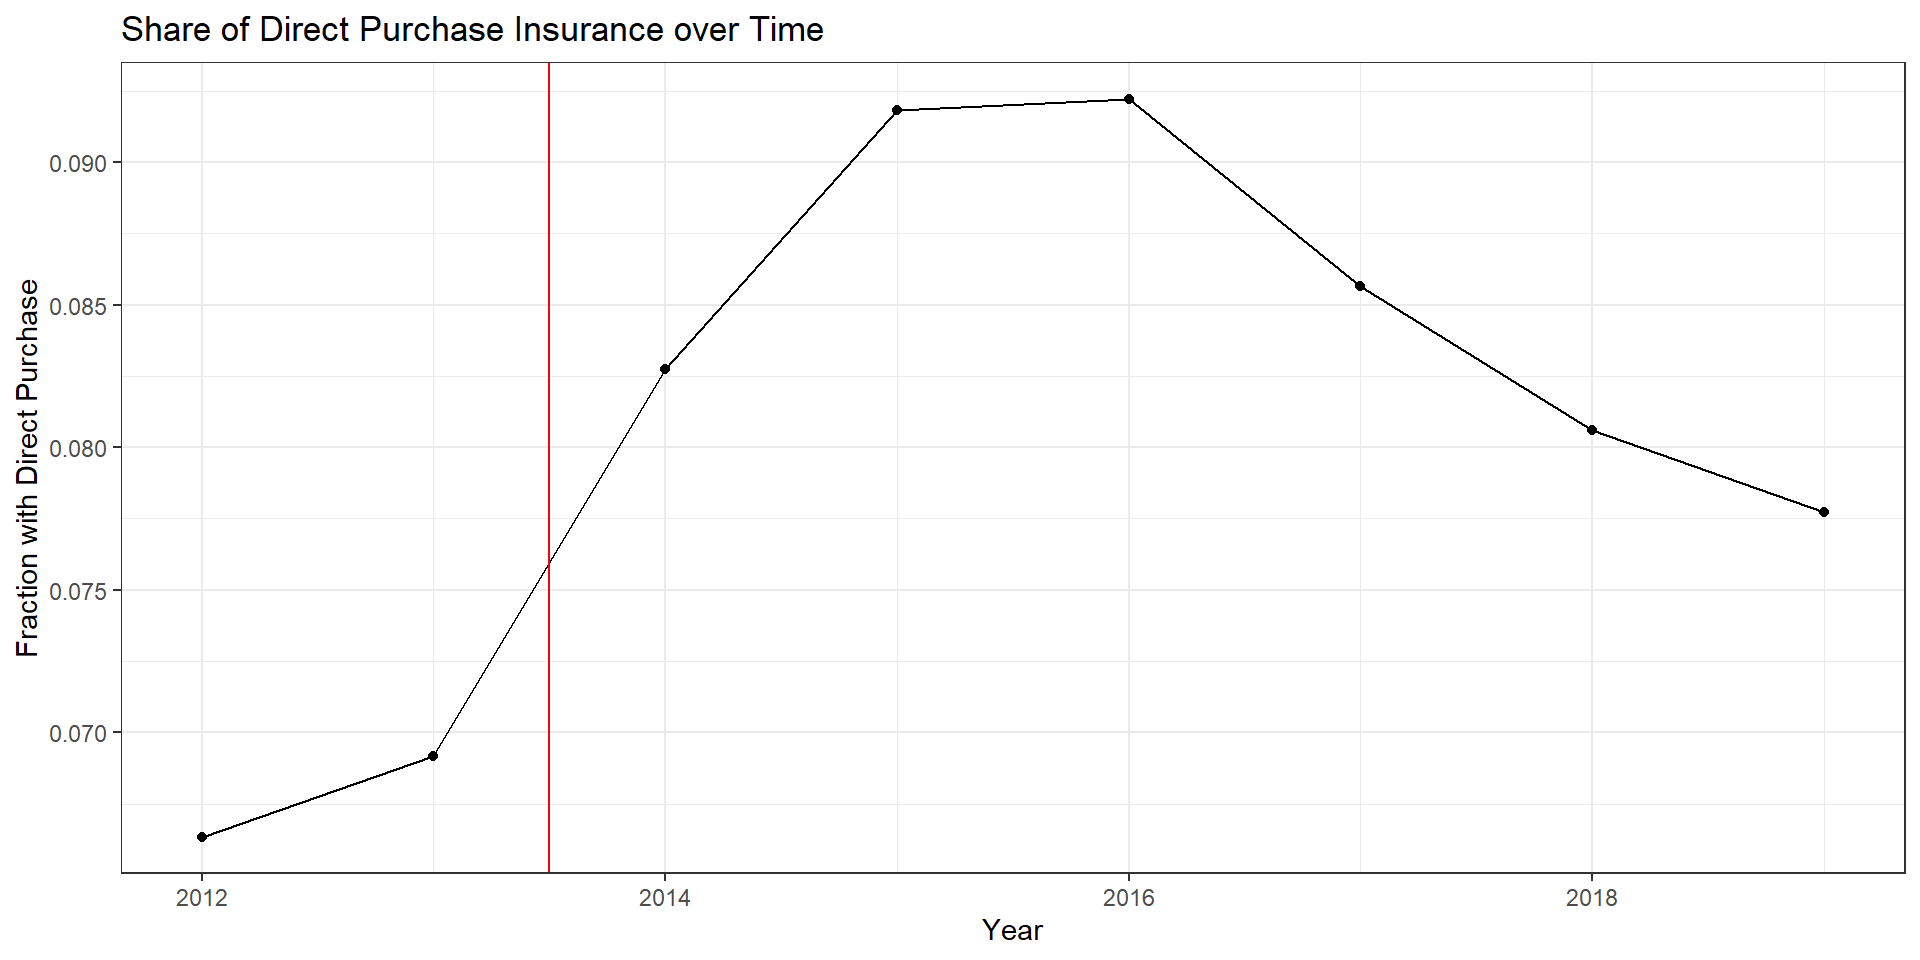
Direct purchase over time
R Code
ins.dat %>%group_by(year) %>%summarize(mean=mean(perc_direct)) %>%ggplot(aes(x=year,y=mean)) +geom_line() +geom_point() +theme_bw() +labs(x="Year",y="Fraction with Direct Purchase",title="Share of Direct Purchase Insurance over Time" ) +geom_vline(xintercept=2013.5, color="red")
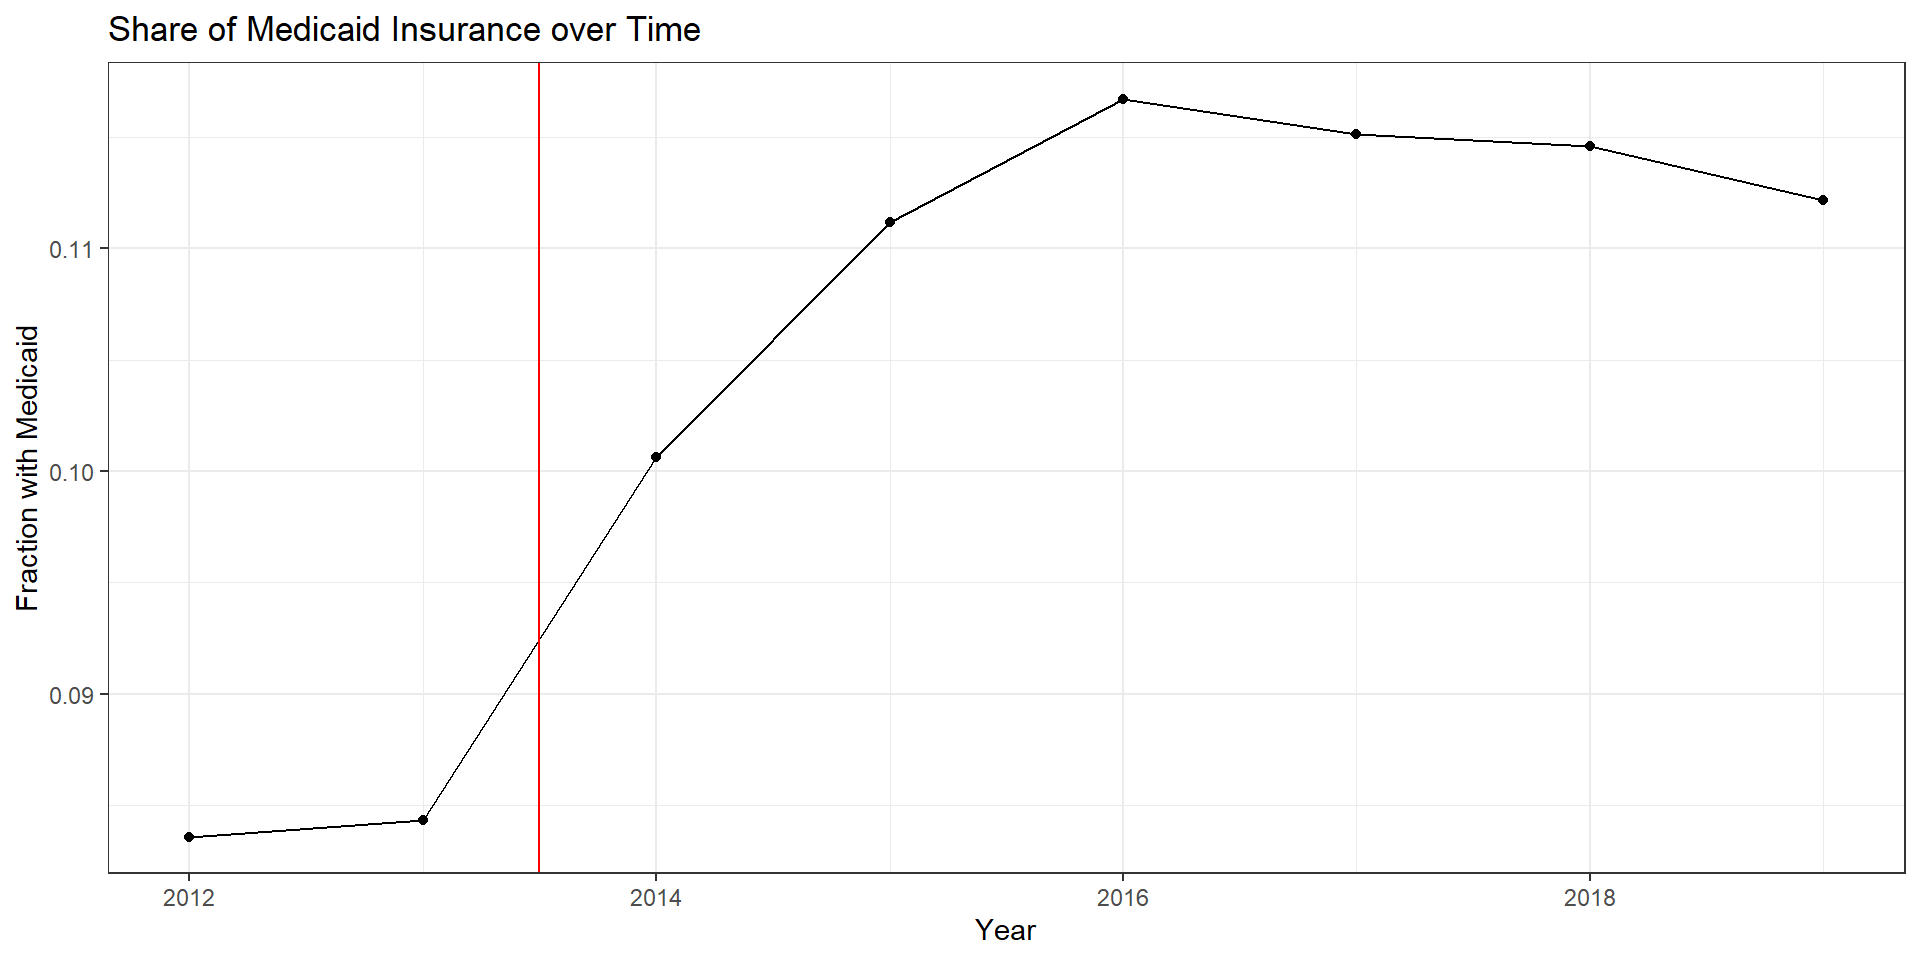
Medicaid over time
R Code
ins.dat %>%group_by(year) %>%summarize(mean=mean(perc_medicaid)) %>%ggplot(aes(x=year,y=mean)) +geom_line() +geom_point() +theme_bw() +labs(x="Year",y="Fraction with Medicaid",title="Share of Medicaid Insurance over Time" ) +geom_vline(xintercept=2013.5, color="red")
Main takeaways
Large reduction in uninsured population following ACA
Biggest gains going to direct purchase (exchanges) and Medicaid (expansion)
Hospital Uncompensated Care
Defining Uncompensated Care
Uncompensated care is hospital care for which no payment is received. It includes:
Charity care: care provided with an expectation of nonpayment.
Bad debt: care initially expected to be paid but ultimately unpaid.
Typically measured in charges or costs, with accounting practices varying across hospitals
Measuring Uncompensated Care
In HCRIS, uncompensated care is derived from Medicare cost report accounting, not patient-level data:
Charity care: reported charges for services designated as charity care, converted to costs using the hospital’s cost-to-charge ratio.
Bad debt: unpaid patient obligations after collection efforts, net of recoveries; Medicare-reimbursable bad debt is reported separately.
Reflects accounting definitions and reporting incentives, which may change over time and differ across hospitals
Medicaid expansion dates by state from Kaiser Family Foundation
Some background code for working with these data are available here. Note that this repository covers more than what we use in this class. In our case, we’re only working with the KFF Medicaid expansion data.
Directly dowload from KFF website (one .csv file) and upload to Open OnDemand if using
Merging HCRIS and KFF data
Standard join by state, but KFF data show state name while HCRIS has state abbreviation
state_xwalk <-tibble(state_abb = state.abb,state_name = state.name)hcris.mcaid <- hcris.data %>%left_join(state_xwalk, by =c("state"="state_abb")) %>%left_join(kff.final, by=c("state_name"="state")) %>%filter(! state %in%c("DC", "GU", "PR", "MP", "VI"))
import pandas as pdfrom us import states# Build state crosswalk (50 states only, like R's state.abb/state.name)state_xwalk = pd.DataFrame({"state_abb": [s.abbr for s in states.STATES],"state_name": [s.name for s in states.STATES]})hcris_mcaid = ( hcris_data .merge(state_xwalk, left_on="state", right_on="state_abb", how="left") .merge(kff_final, left_on="state_name", right_on="state", how="left") .query("state not in ['DC', 'GU', 'PR', 'MP', 'VI']"))