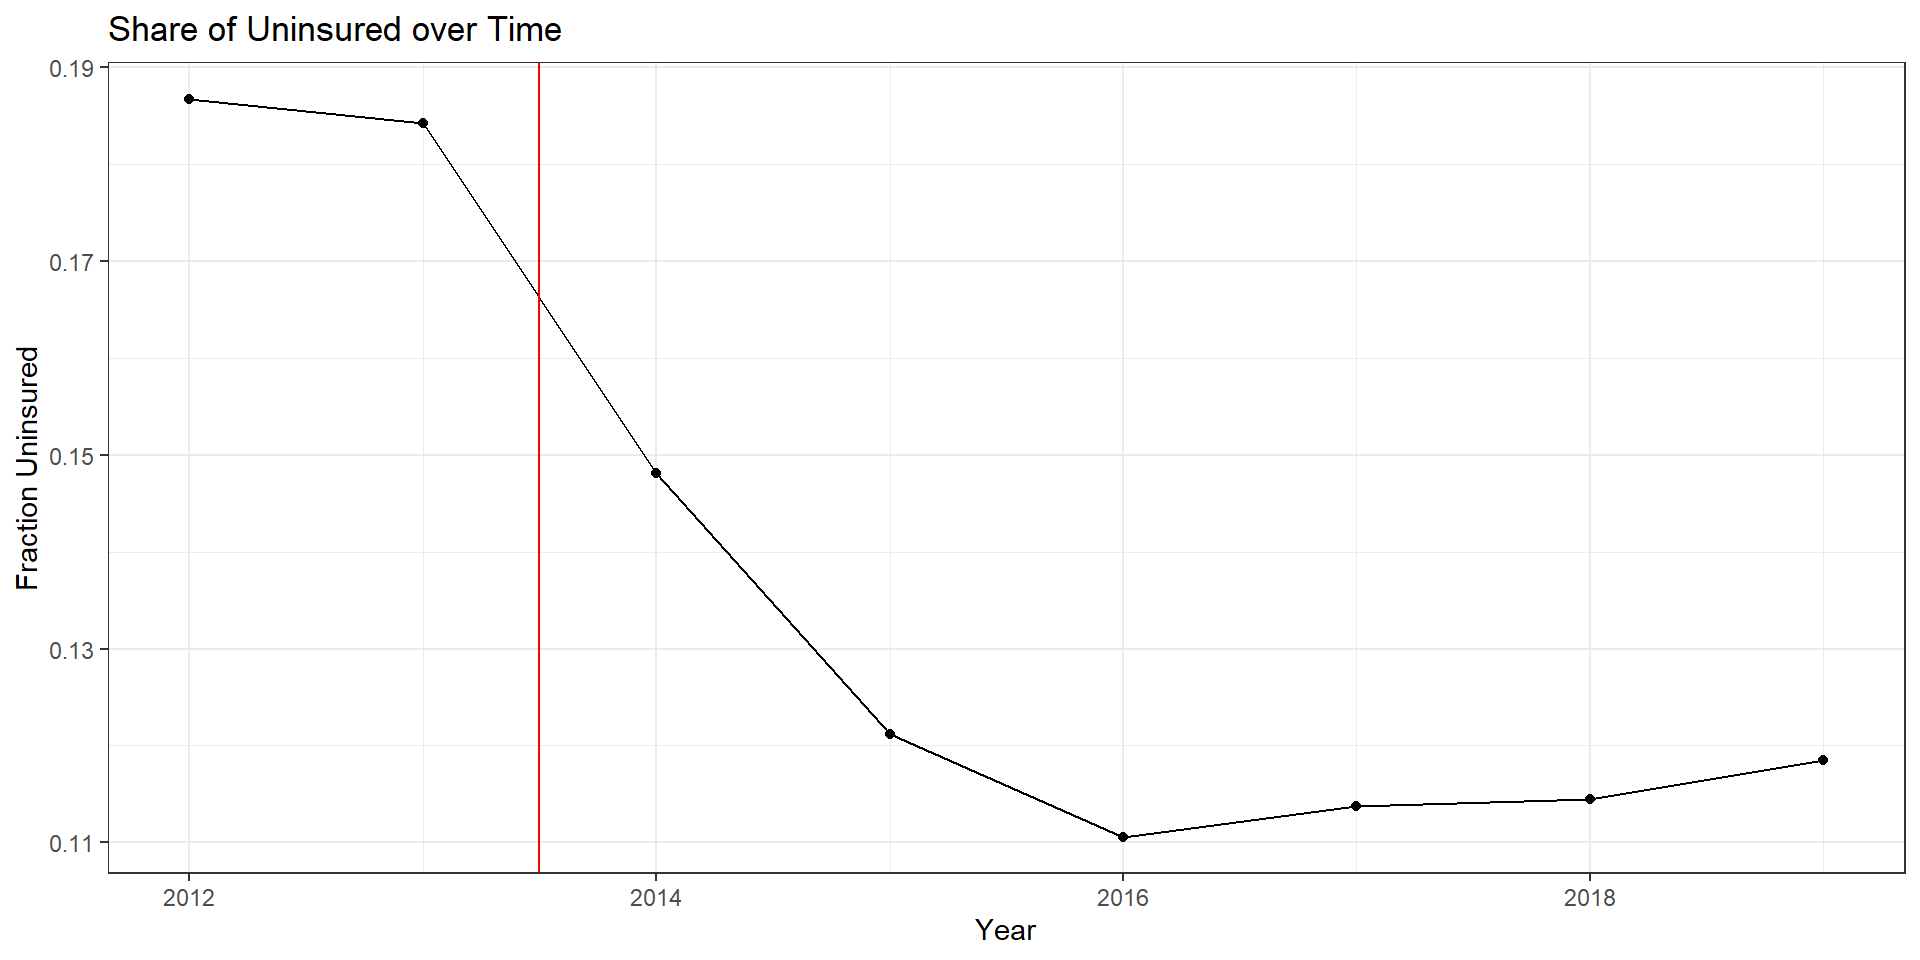
ins.dat %>%group_by(year) %>%summarize(mean=mean(perc_unins)) %>%ggplot(aes(x=year,y=mean)) +geom_line() +geom_point() +theme_bw() +labs(x="Year",y="Fraction Uninsured",title="Share of Uninsured over Time" ) +geom_vline(xintercept=2013.5, color="red")
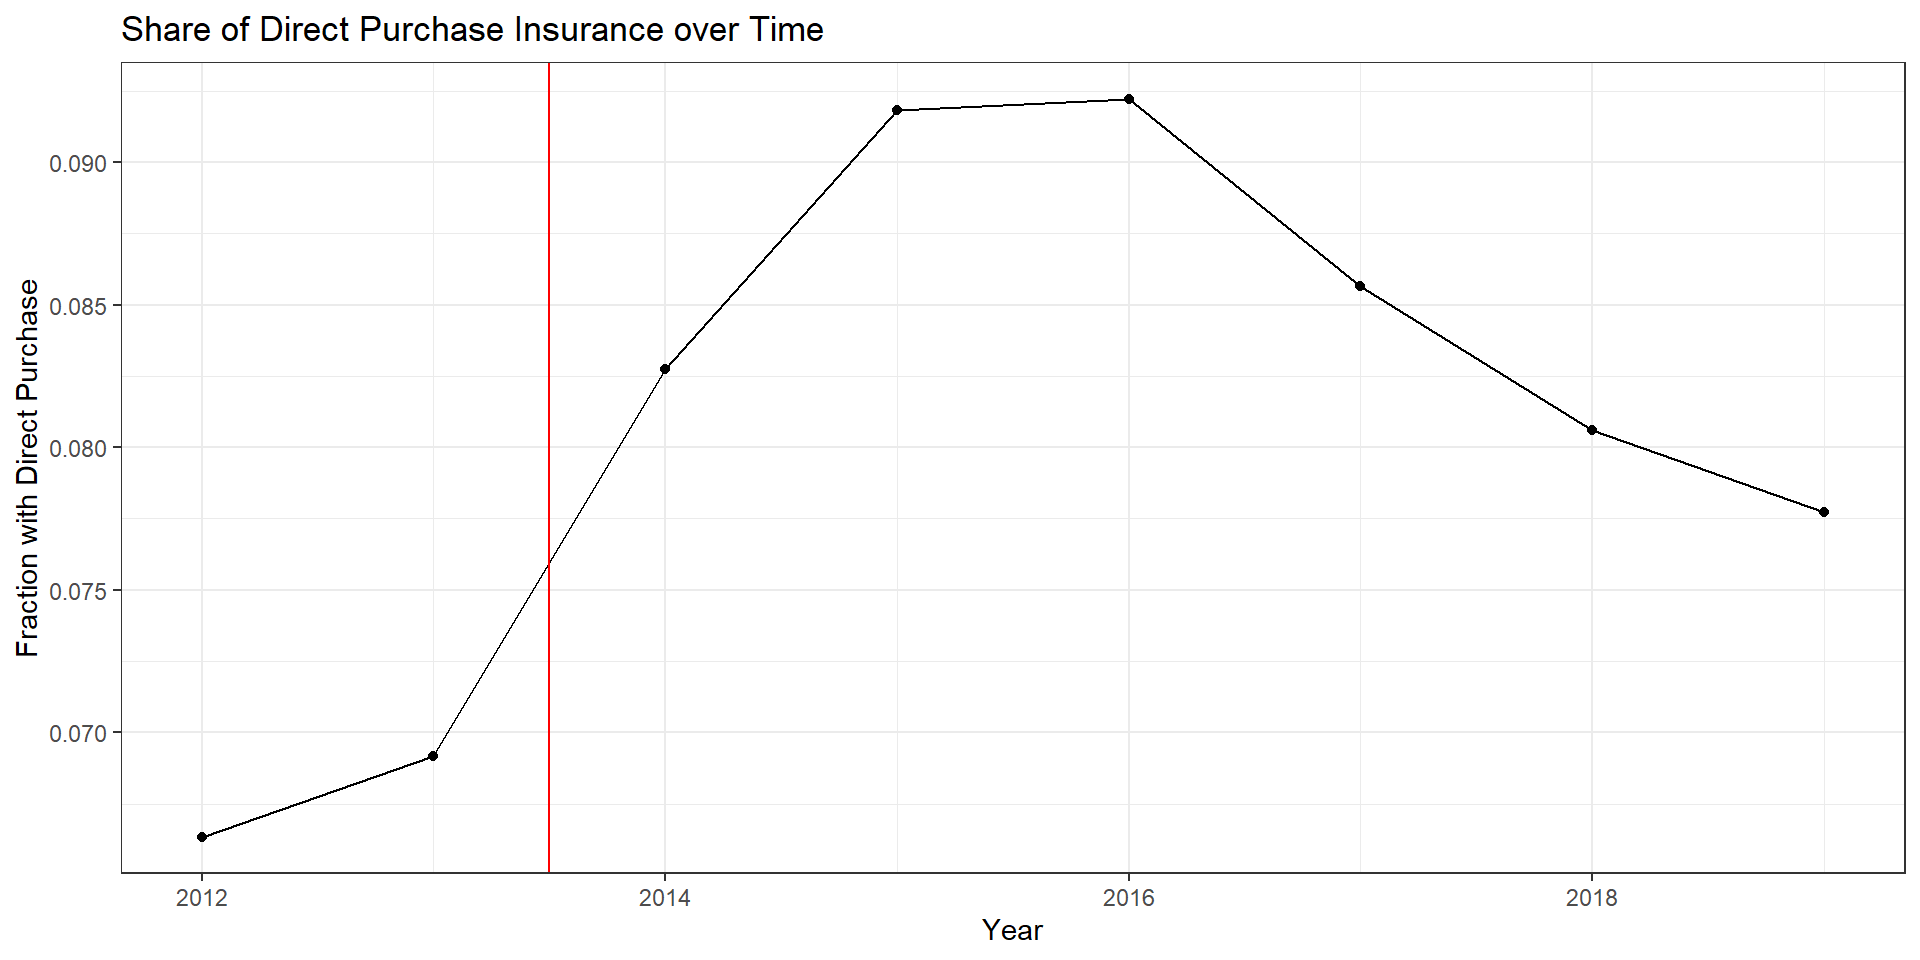
Direct purchase over time
R Code
ins.dat %>%group_by(year) %>%summarize(mean=mean(perc_direct)) %>%ggplot(aes(x=year,y=mean)) +geom_line() +geom_point() +theme_bw() +labs(x="Year",y="Fraction with Direct Purchase",title="Share of Direct Purchase Insurance over Time" ) +geom_vline(xintercept=2013.5, color="red")
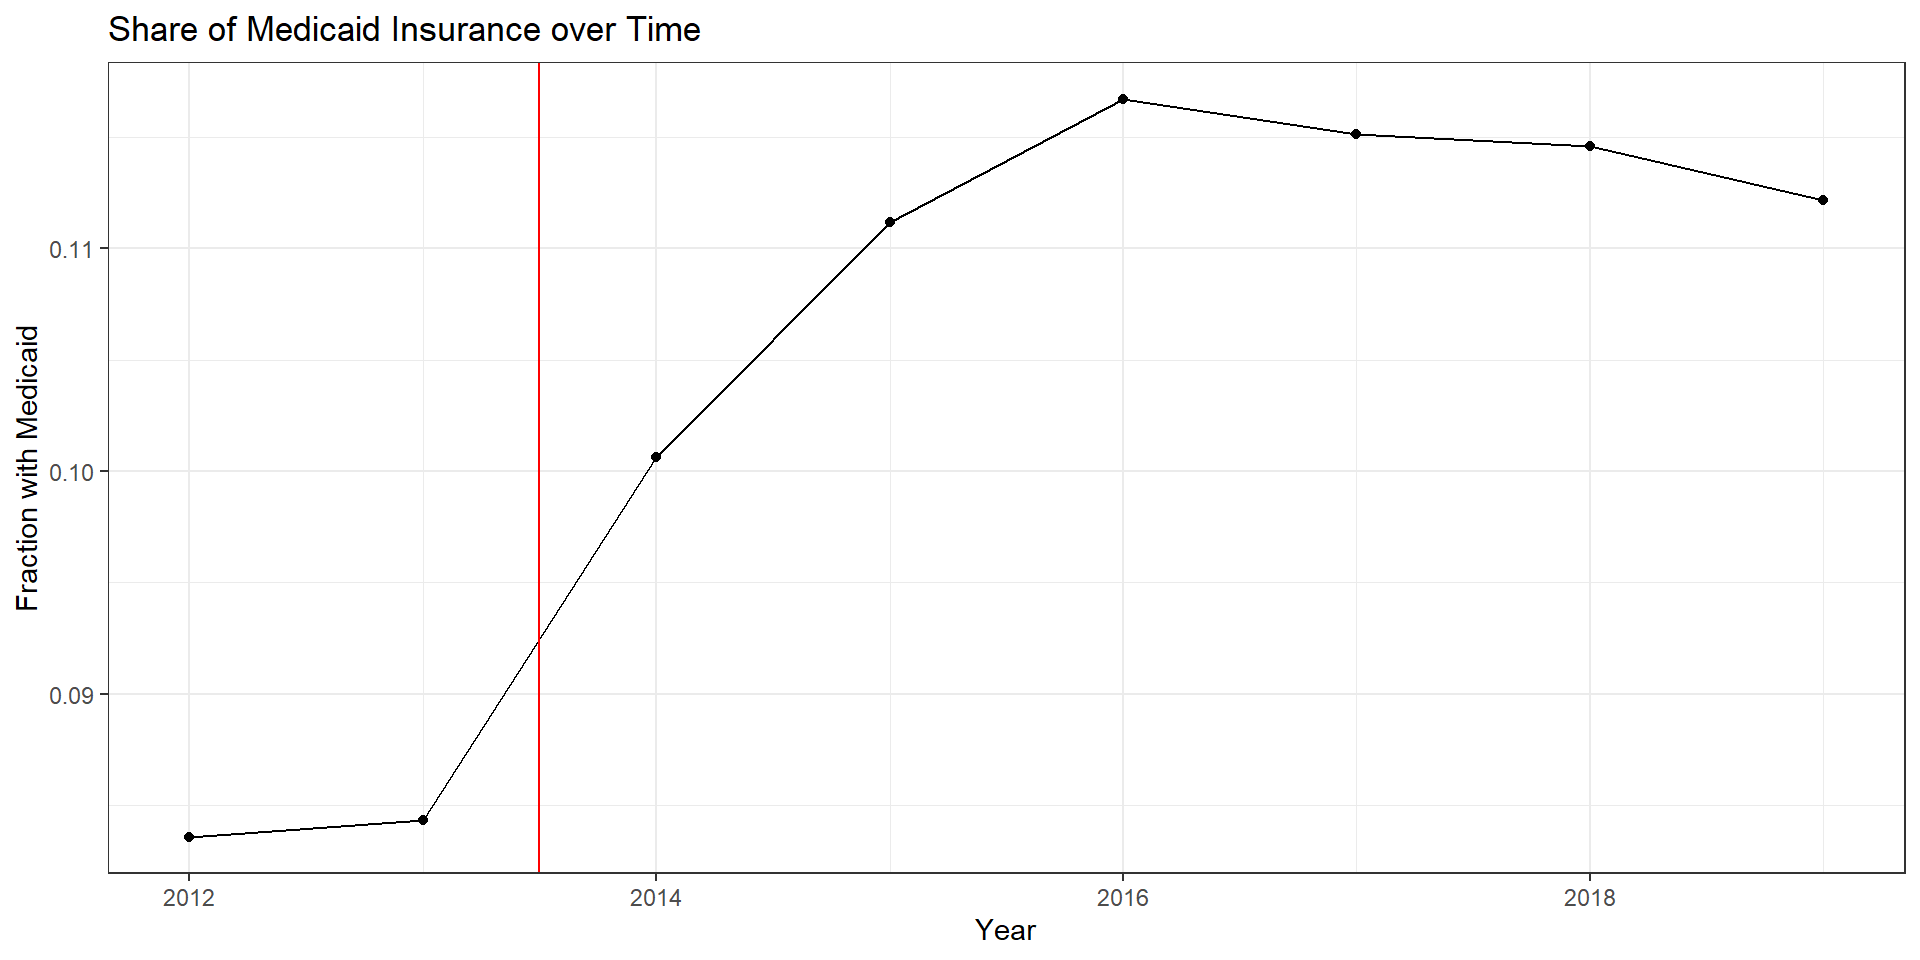
Medicaid over time
R Code
ins.dat %>%group_by(year) %>%summarize(mean=mean(perc_medicaid)) %>%ggplot(aes(x=year,y=mean)) +geom_line() +geom_point() +theme_bw() +labs(x="Year",y="Fraction with Medicaid",title="Share of Medicaid Insurance over Time" ) +geom_vline(xintercept=2013.5, color="red")
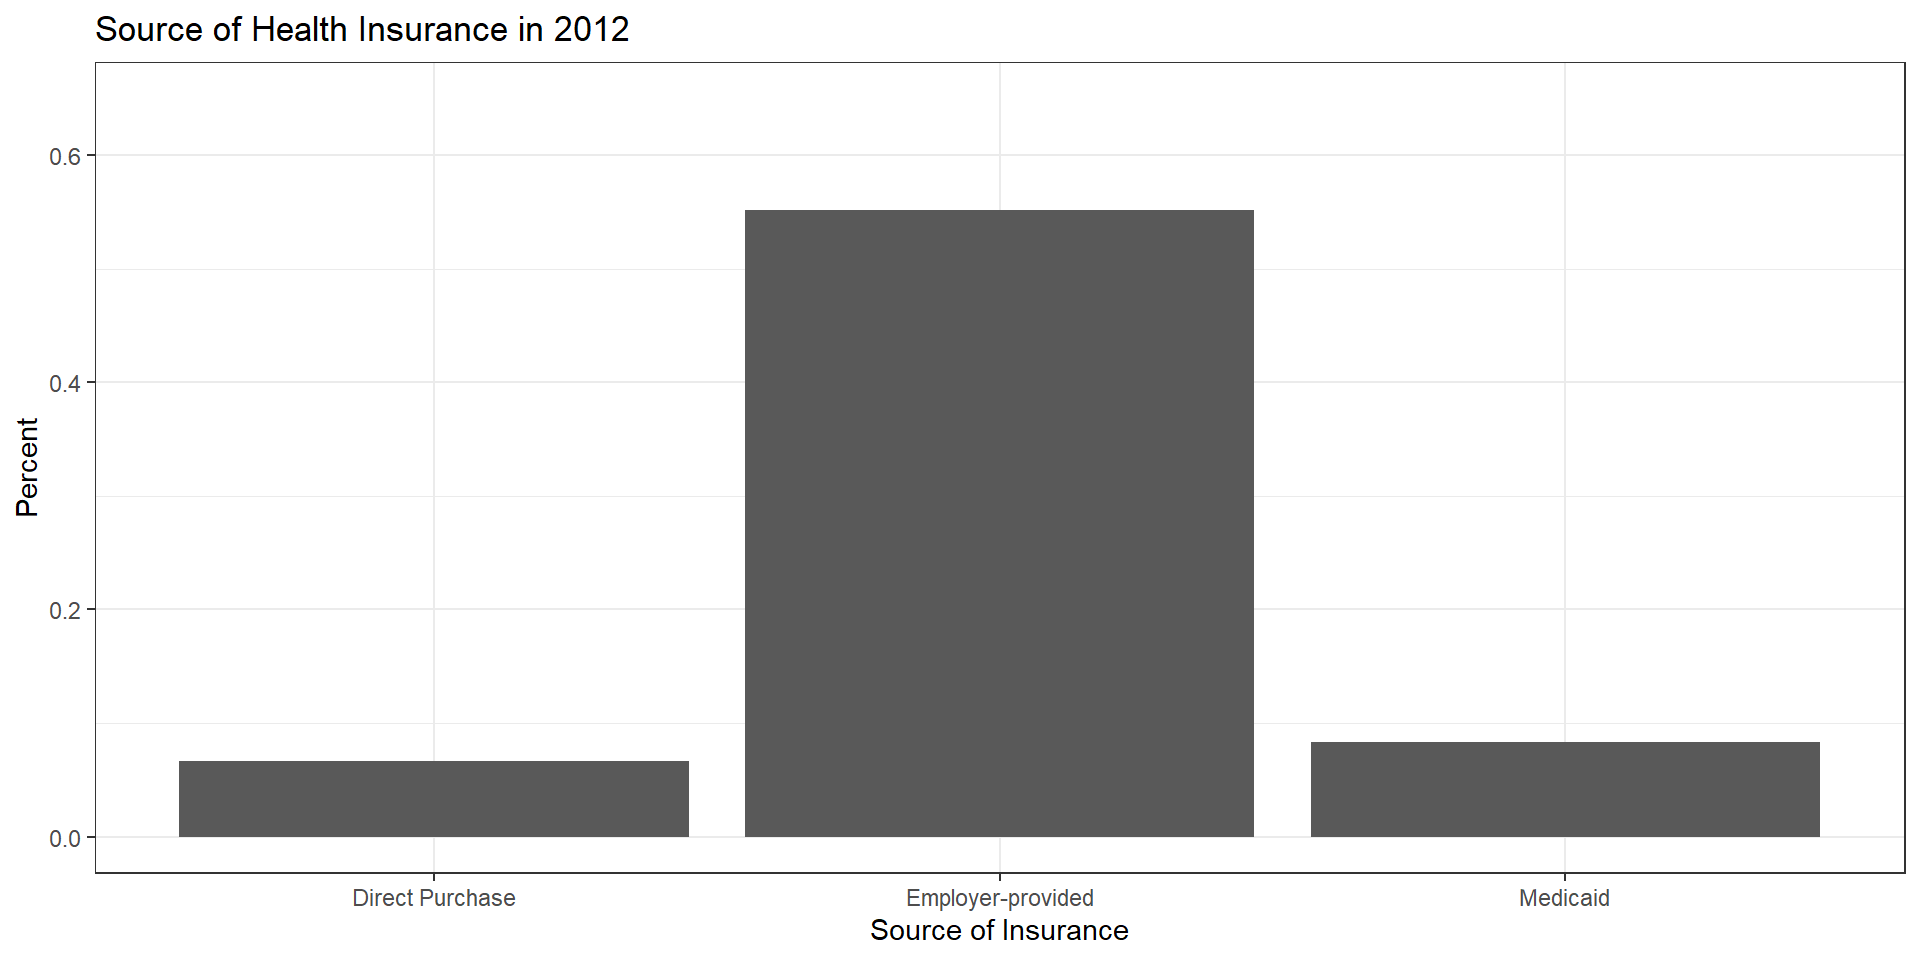
Main takeaways
Large reduction in uninsured population following ACA
Biggest gains going to direct purchase (exchanges) and Medicaid (expansion)
But what amount of extra insurance is due to Medicaid expansion? In other words, who got insurance through Medicaid that wouldn’t have gotten it otherwise?
What does the literature say
The Kaiser Family Foundation has some great info on this…