Prices! (outcome of many underlying factors including information problems, fragmentation, policy, etc.)
Some fraud
Rephrasing of the Problem
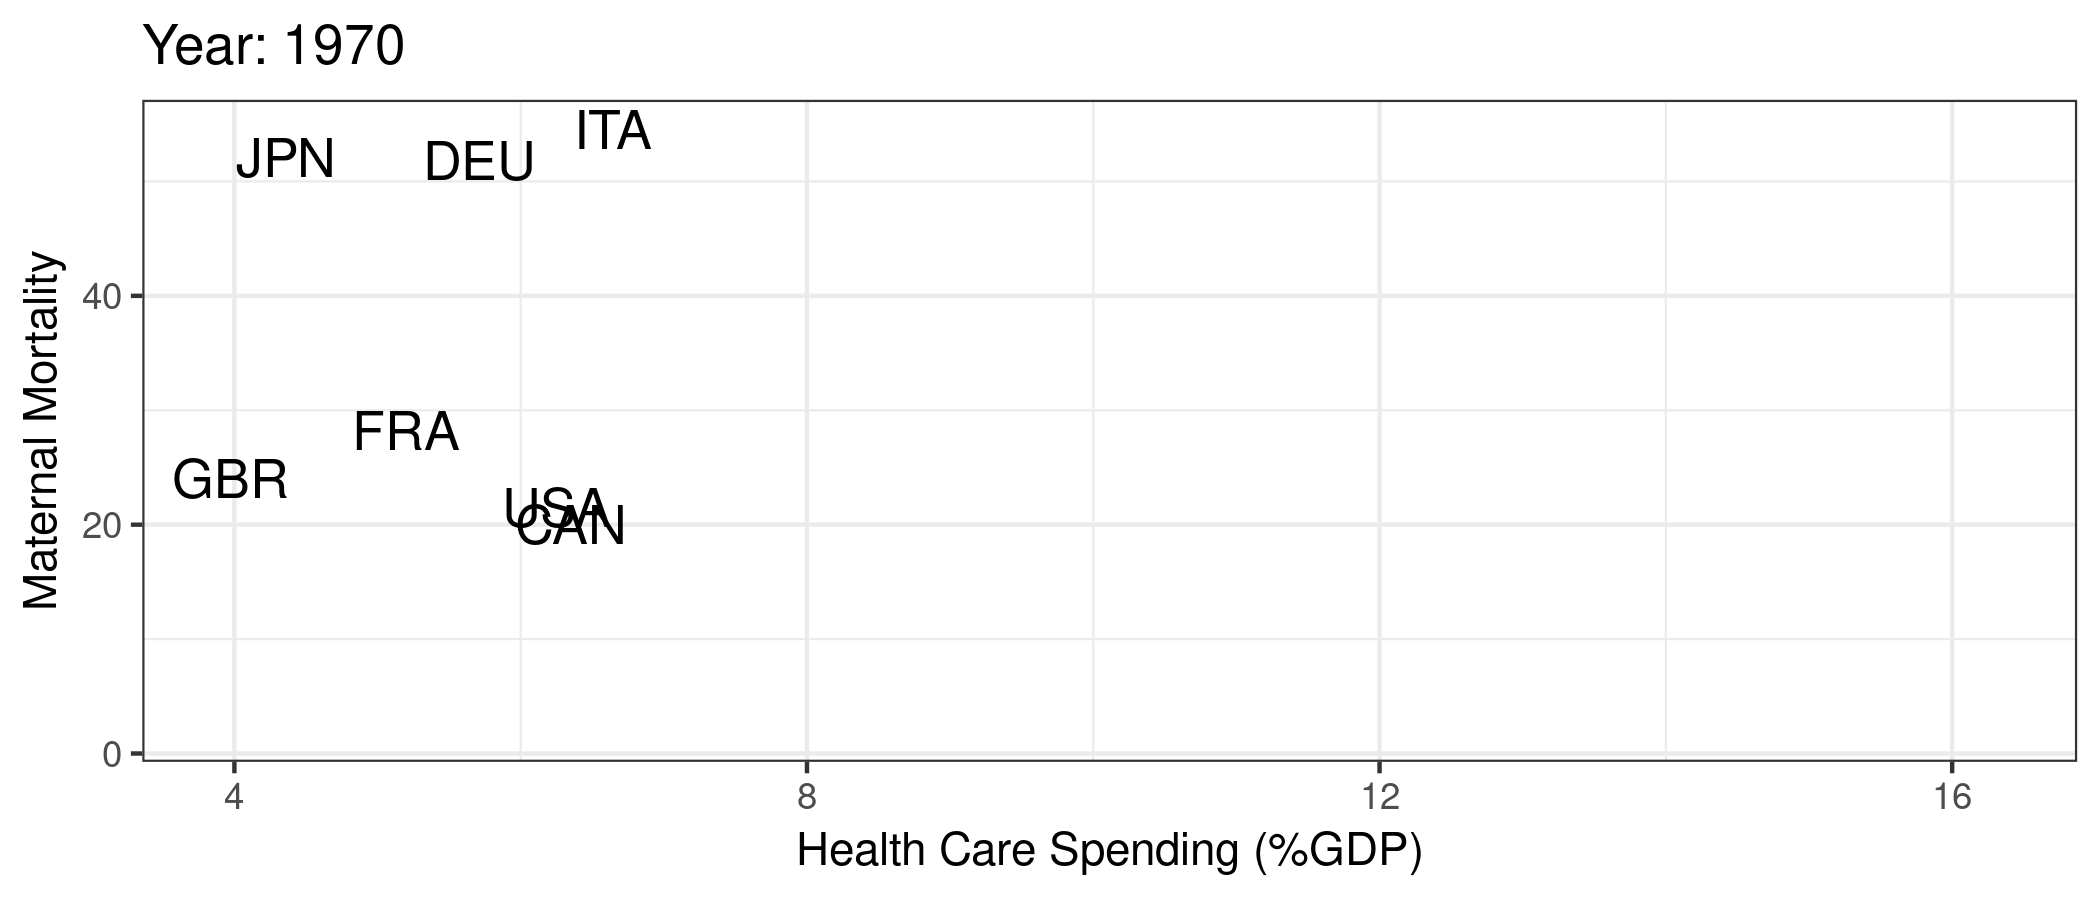
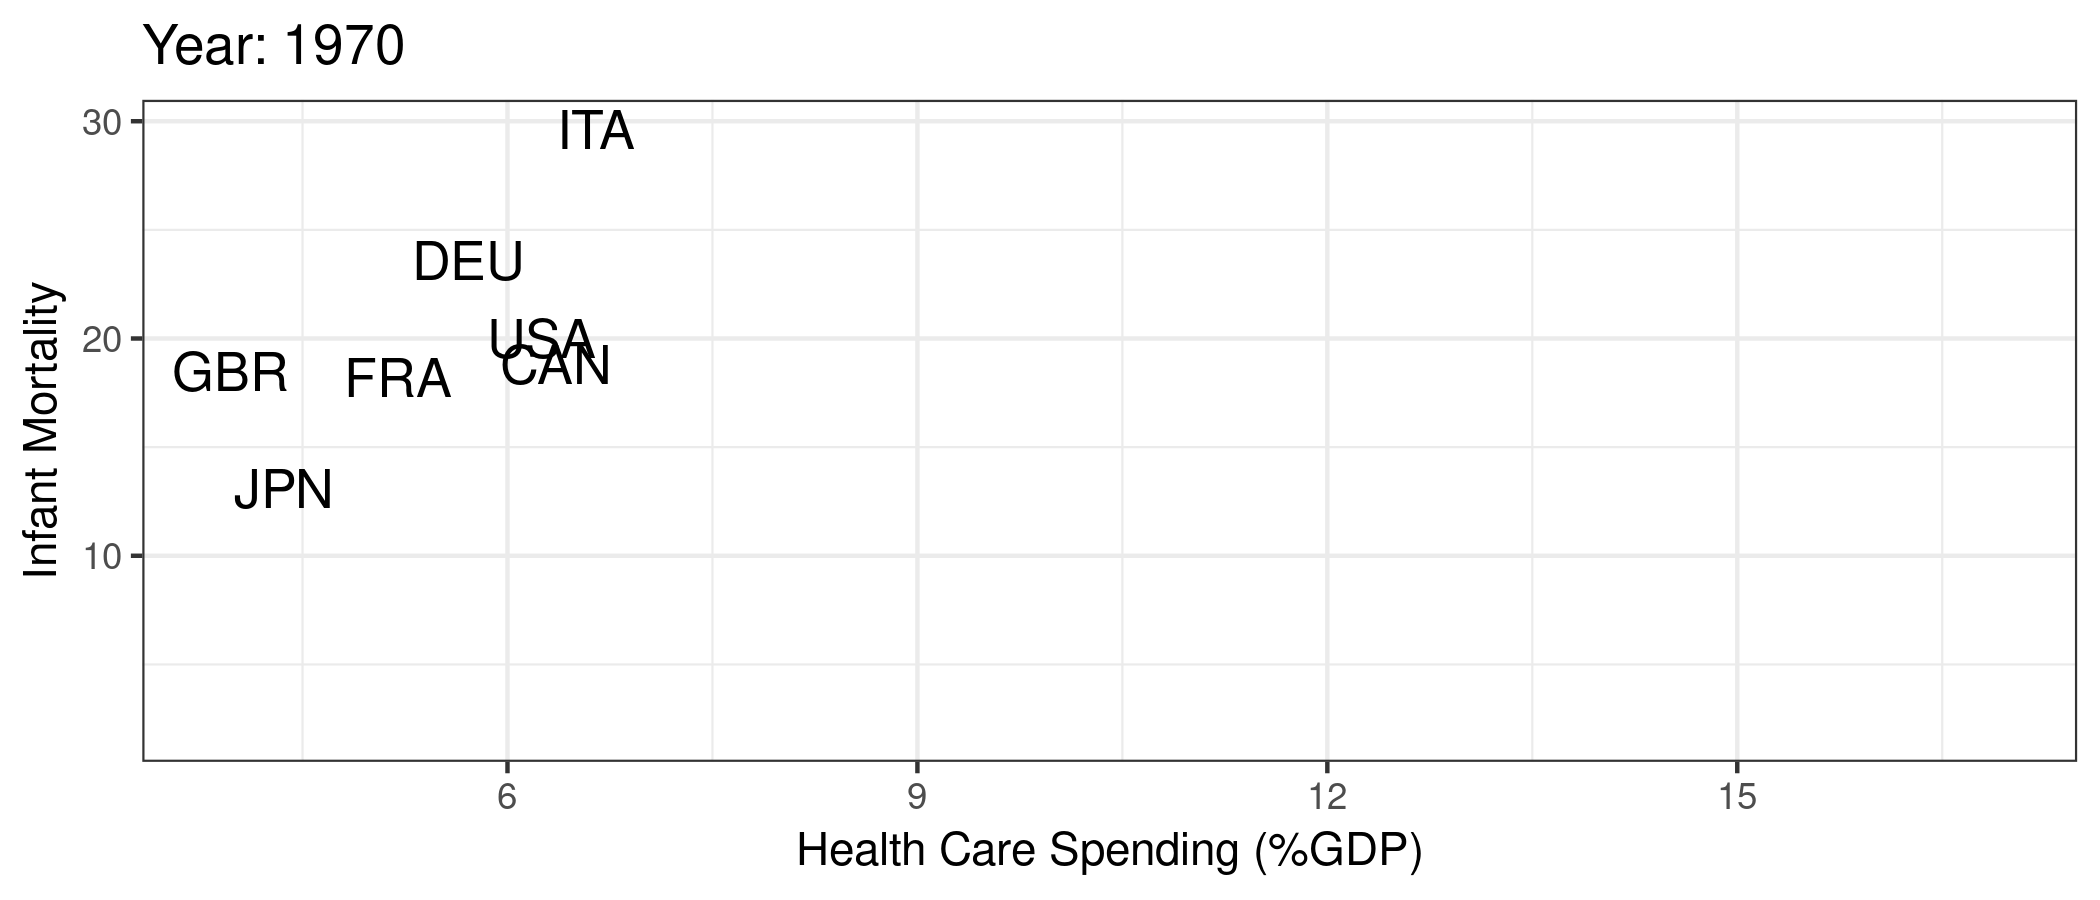
We have an “access” problem in the U.S. In many ways, we “overprovide” care to some people and underprovide care to lots of other people. We are particularly bad at helping the least healthy among us. These issues are, of course, very closely related to other economic problems and inequality in general.
Turning to this course…
Why economics?
Lots of interesting economic issues in health care, not all unique to the US.
Extremely heterogeneous products
Asymmetric information between patients and physicians
Unobservable quality (experience good)
Unpredictable need (inability to shop in many cases)
Distortion of incentives due to insurance
Adverse selection (asymmetric information between patients and insurers)
Why economics?
These factors exist in other markets and in other countries, but…
Health care is unique in the combination of these issues
U.S. is unique in the extent of these issues in health care (policy problems)
Course Overview
We study U.S. health care through the patient’s journey:
Insurance – choosing a plan
Adverse selection, moral hazard, market design
Physicians – visiting a doctor
Agency problems, financial incentives, quality of care
Hospitals – receiving care
Pricing, insurer negotiations, consolidation
Prescription Drugs – patents, generics, FDA regulation, innovation
Learning Goals
By the end of this course, you will be able to:
Explain the structure and history of the U.S. health care system
Model adverse selection in insurance and connect to data
Analyze physician incentives and agency problems
Describe hospital pricing and insurer negotiations
Summarize key features of prescription drug markets
Apply data to assess hospital policies in practice
Assignments & Logistics
Participation – in-class and Canvas activities
Homework (3) – mix of theory and data, ~60 pts each
Midterm Exam – 60 pts (Tuesday, 10/21)
Final Project – group-based, 140 pts
Total = 400 points → standard grading scale
Class meets: Tues/Thurs, 8:30–9:45am, White Hall 103
Office Hours: Tues/Thurs, 10–11am, RRR 418 (or by appointment)
Nuts and Bolts
Class Website – slides, notes, assignments, data
Canvas – readings, grades, announcements, private info (e.g., Zoom links)