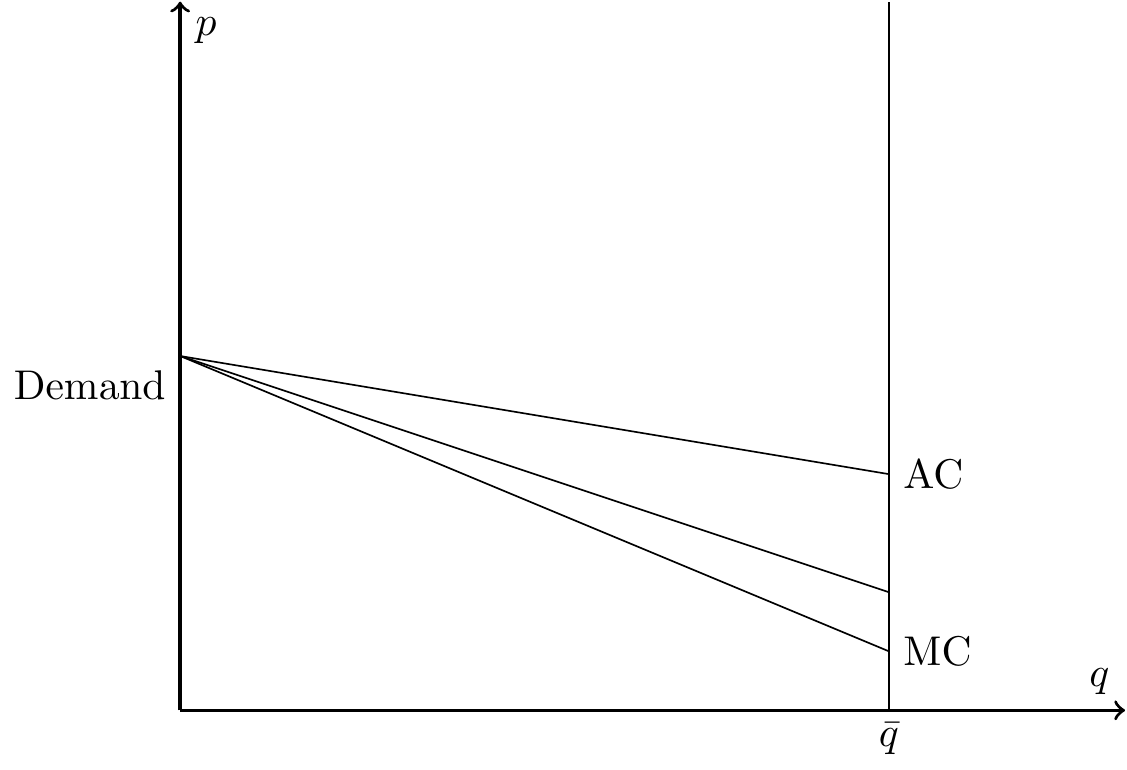
Adverse Selection and Pricing

Ian McCarthy | Emory University

Adverse selection

In practice, people know more about their health than insurers. This is a form of asymmetric information.

Here’s a good example, Costs during special enrollment periods.
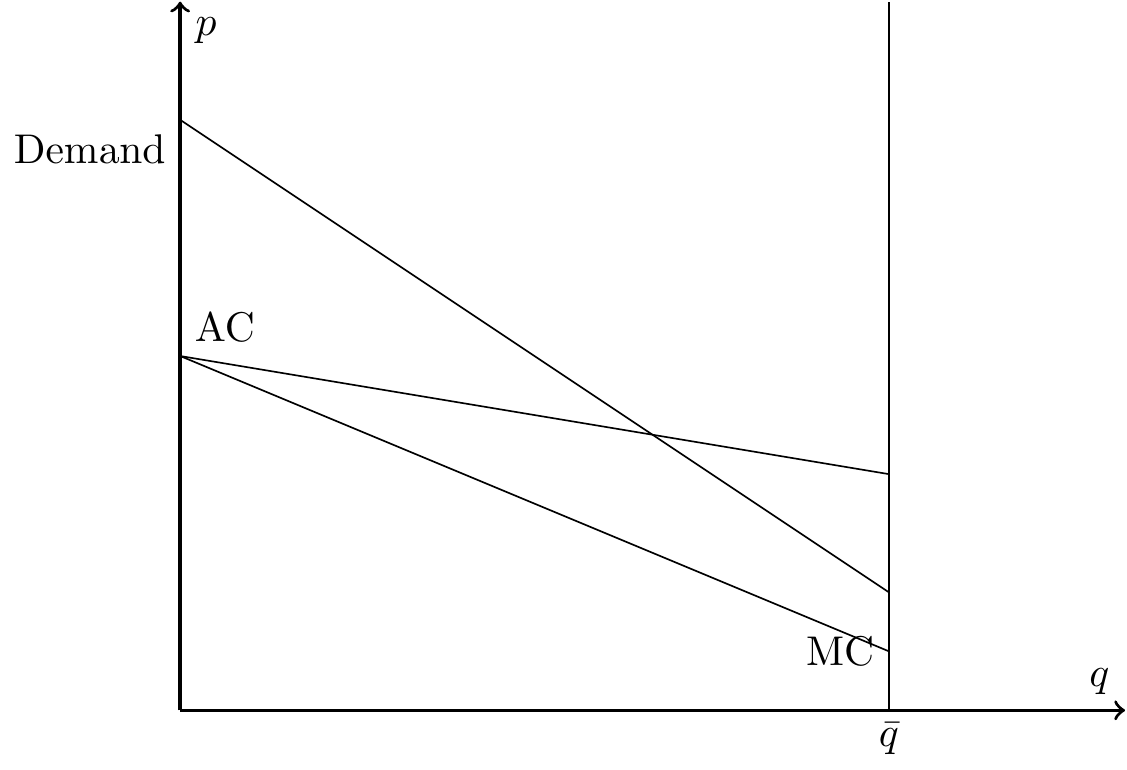
Textbook depiction of adverse selection

Description of graph

  • Demand (willingness to pay) for health insurance
  • Average cost (AC): average healthcare costs incurred by all enrollees
  • Marginal cost (MC): additional healthcare costs incurred by one more enrollee
  • Downward sloping because healthier individuals (lower cost) are willing to pay less for health insurance
  • \(D>MC\) because willingness to pay is expected costs plus risk premium
  • Relationship between demand and AC reflects problems due to adverse selection

Assumed equilibrium

  • Simplifying assumption that insurers earn 0 profit (at least approximately)
  • Equilibrium point where \(D=AC\)
  • Clearly not true, but it helps us focus on adverse selection and avoid everything else

1. Full insurance

Demand always above AC

2. Under-insurance (partial unravelling)

Demand intersects with AC somewhere

3. Full unravelling

Demand always below AC

For any amount of unravelling, we need at least two features in the market:
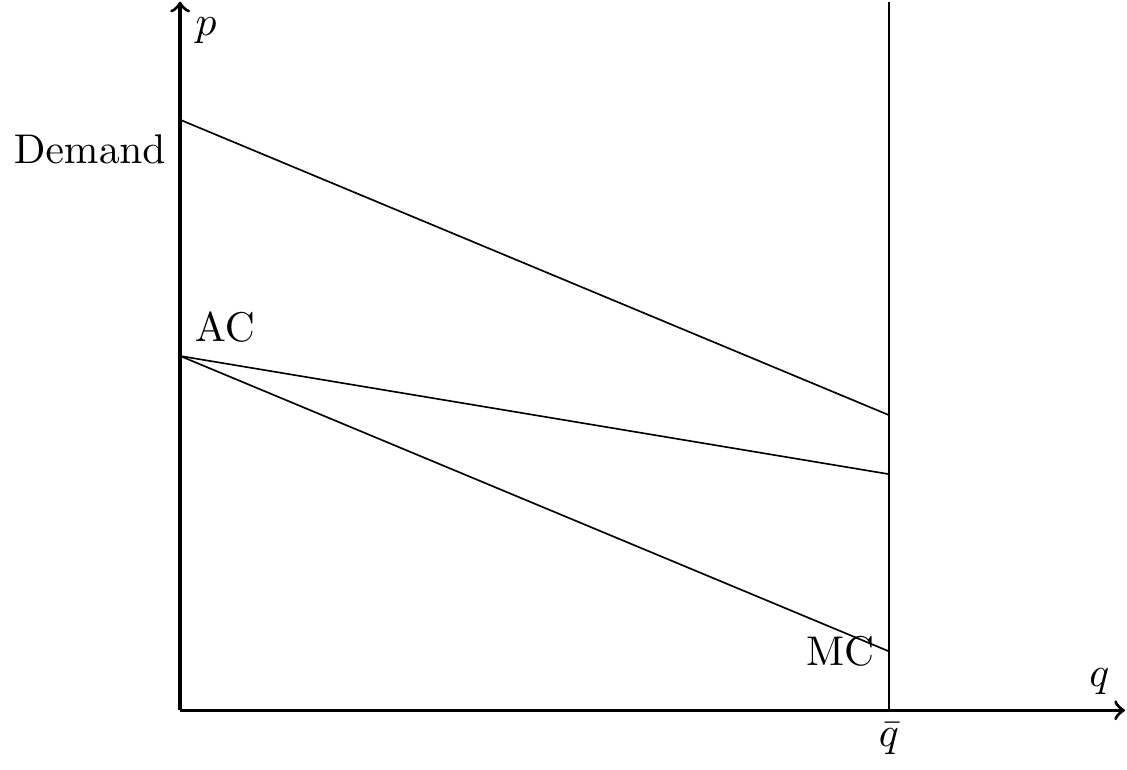
  1. Individuals select plans based on health needs (which is private information)
  2. Common price to all enrollees of a given plan (community rating)

To think about unravelling, we need to think of this graph in stages or periods.

  • In the initial period, insurers set prices, unsure about who will enroll because healthcare needs are private information
  • Upon setting premiums, insurers will know who enrolled and they will know the costs they incurred by the end of the year
  • Insurers can then update their premiums if needed (we will again assume zero profits to keep things simple)

Conceptual Example

  • Assume the demand curve is below AC at least beyond some point (not necessarily always below AC)
  • In the initial period, assume an insurer sets the premium at a point such that \(AC>D\)
  • In the subsequent period, knowing that costs were too high relative to premiums, the insurer increases their premium
  • Increase in price means a movement up the demand curve, but who leaves the market?
  • the relatively healthy or low cost individuals!
  • so AC is now higher, and the insurer will need to continue raising premiums until they reach equilibrium

Numerical Example

Assume the insurer’s cost function is \(C=100q - 2q^{2}\), where \(q\) denotes the number of people enrolled in the plan. Further assume that demand is given by \(D=140-4q\). Assuming the insurer enters the market with \(p_{1}=40\),

  1. What is the next year’s price (if profits are $0 based on period 1)?
  2. What is the equilibrium price?

Answer

To solve this, we need to first calculate the marginal cost curve, \(mc=100-4q\), and the average cost curve, \(ac=100-2q\). At a price of \(p=40\), we know that quantity demanded will be \(q=25\). At that point, the average cost is then $50. Since \(AC>p\), the firm is losing money. If they set prices to break-even, then next period’s price would be set to their observed AC, \(p_{2}=\) $50. We can find the equilibrium price as the point where the AC and D curves intersect, which occurs at \(q\) of 20 and price of $60.

In-class Problem: Adverse selection

Assume that the insurer’s cost function is given by \(C=100q - 2q^{2}\), where \(q\) denotes the number of people enrolled in the plan. Further assume that the inverse demand function takes the form, \(D=110 - 3q\), and that there are 20 individuals total in this market.

  1. If the insurer enters the market at a price of $65, what is the insurer’s profit (or loss)?
  2. What price does the insurer set next year if they set price equal to average cost in the prior year?
  3. What is the equilibrium price in this market?
  4. What if there is a $10 penalty imposed for those that do not purchase health insurance?

Death spiral!

Paul Ryan on Death Spirals

spend

Death spiral!

So, are the exchanges in a “death spiral”?

Standard & Poor’s writes: “The ACA individual market is not in a ‘death spiral.’ However, every time something new (and potentially disruptive) is thrown into the works, it impedes the individual market’s path to stability.”

Some potential policy solutions

  1. Subsidize consumers
  2. Subsidize insurers
  3. Mandate purchases

Can you examine each of these policies graphically? How do they differ from the patient’s or government’s point of view?

Effects from other insurance markets

Based on our discussion of adverse selection and health insurance markets, what would you expect to happen if we increased the Medicare age from 65 to 70 years old?

Advantageous selection

What if individuals who are high risk are also less risk-averse? In this case, individuals who are willing to pay the most for health insurance (the most risk averse) are actually less risky and therefore the cheapest to insure. Very different policy implications (e.g., individual mandate is bad in this case).

Main takeaways

  1. Explain, using a graph, how unravelling could occur in a market with adverse selection.

  2. Discuss and show graphically how an individual mandate or subsidies could help to alleviate or minimize the adverse selection problem.